A checklist to validate sensor output for the recording of cattle behaviour
Alex Bach 2
Bruno Meunier 1
Emma Ternman 3
Kees Van Reenen 4
Isabelle Veissier 1
Lene Munksgaard 3
1 Université Clermont Auvergne, INRAE, Saint-Genès-Champanelle, France
2 Institució de Recerca i Estudis Avançats (ICREA), Barcelona, Spain
3 Aarhus University, Tjele, Denmark
4 Wageningen University & Research, Wageningen, Netherlands
Keywords
automated monitoring, animal welfareIntroduction
A process of validation assesses the appropriateness and usefulness of a tool for its intended purpose within a specific context. Ideally, the validation of a tool should describe the range of purposes and contexts in which it is appropriate. In general this cannot be accomplished completely. Therefore, when such a wide validation cannot be done, the validation process needs to refer clearly to the purpose of the use of the tool and to which animals it is going to be applied.
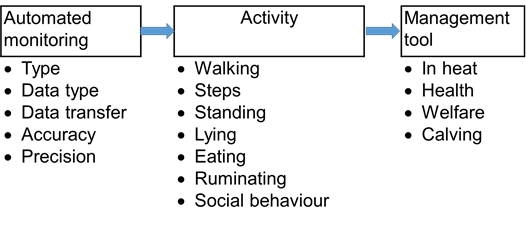
The technological development has led to an increase in the number of sensors and devices that are available for measuring cattle behaviour. The technical solutions behind the sensors can differ substantially, sensors use accelerometer technology, sound recording or image analysis to mention some, and even within each solution, there is a large amount of factors that can influence the quality of the sensor’s information output or battery capacity. The raw data from the sensor is usually translated through algorithms to estimate the behaviours in question and such algorithms may vary in the way they work. There might be data points for individual animals or whole groups missing for some periods. The attachment of the sensor itself sometimes may affect the animals’ behaviour. Furthermore, some sensors are developed for use on commercial farms and others for research use only, with differences in precision and accuracy. A careful evaluation of the purpose and validation of the outputs from sensors for measuring cattle behaviour is required before use (Figure 1). To be able to compare the output from different devices across facilities a standardized validation protocol would be helpful. Therefore, a sensor validation guidance has been included with this chapter which discusses important factors that can affect the outcome of a validation. For instance: be aware that a system that has been validated for small ruminants may not be valid for cattle, and vice-versa. Indeed the anatomy of the animal is already a difference that should be considered when testing a behaviour sensor.
Prerequisites
This guideline is developed in the SmartCow project as collaboration between the partners in working package 7 with input from other partners in the project working with devices that automatically measure behaviour. The guideline is not a detailed description of how to validate specific sensor output, but a list of items to consider, thus it is more of a checklist to consult before a study to validate a sensor for measuring cattle behaviour.
A – Description of the equipment used
In order to compare the outcome of validation studies, it is important that a proper description of the equipment in use is provided. A description should include minimum requirements, described in the two following paragraphs (sensor technology and data from the sensor), and non-exhaustive additional information, which can be added if relevant to interpret the dataset provided by the device. Criteria retained to describe devices have been chosen as a result of literature review of validation studies. We will illustrate most of the retained items by examples taken from the literature or built by our own when nothing relevant was found.
Some basic information is needed to describe the sensor, this information is mainly provided by the manufacturer and easy to catch. It can help understanding how the device works and what implication it might have on data acquisition and/or animal behaviour.
- Type of sensor technology: This information is the most important to describe the sensor under study. Technological solutions vary between sensors, for example accelerometer, Real Time Location System (RTLS), Global Positioning System (GPS), weighing scales – thus it is important to be precise in the technology description.
- Commercial Name/Company/Version of the Sensor: The aim is to give information about the exact model/version of the sensor used, to easily identify it and make it findable for other applications. This is information given by the manufacturer.
Example: “The acceleration sensor used was the ADXL335 (Analog Devices, One Technology Way, P.O. Box 9106, Norwood, MA 02062–9106, USA), a complete tri-axial accelerometer.” [1]
- Sensor weight and size, mounting system and recoverability: This is meaningful information to estimate the interaction between the sensor and the natural behaviour of the cow. Indeed, a small lightweight accelerometer mounted on a collar does not have the same impact on cow behaviour as a large and heavy GPS device fixed on a halter. From an ethical and economic point of view, it also seems relevant to describe the recoverability of the sensor, e.g. an intra-ruminal bolus that cannot be taken back from the animal may need specific authorization, as it might be considered an invasive measurement.
Example 1: Moreau [2] used GPS tracking collar on goats: “The components were placed in a sturdy casing and mounted on a polyester harness adjustable to the animal’s neck. Gross mass of the collar was 610 g.” Meunier [3] equipped dairy cows with “a counter-weighed collar (565 g) on which active tag (6×5×4 cm – 146 g) was mounted”. On these two examples, we can easily assess that 600 g on a goat (which represent 1% of its BW), has not the same impact than 600 g on a dairy cow (which represent approximately 0.1% of its BW).
Example 2: “Rumen pH was monitored continuously throughout the experiment using a commercial sensor […] immersed in the reticulum through the oesophagus with the use of dedicated balling gun.” [4]
- Memory capabilities and battery life: This point aims at ensuring the device will work well during the validation trial. It has to be expressed in terms of duration. Special attention will be paid to the adequacy between the duration of the study and these two criteria: memory capability and battery life. Additionally, technology used to store data and battery technology may be described.
Example 1: “Onset Pendant G data loggers […] were set to record […] at a 6-s interval until the memory storage in the data loggers was full (i.e., approximately 1.5 d).” [5]
Example 2: “The duration of recording varies between 1.5 and 681.3 d (e.g. 45 d at a sample-interval of 1 min).” [6]
Example 3: “Such batteries would need to operate properly and autonomously for long periods of time (e.g., five years) without being recharged or replaced.” [7]
- Sampling rate: If known, sampling rate could be useful in understanding how the measurement is done and/or processed (see below). It has to be expressed in terms of frequency or period (e.g. in Hz or points per min).
Example: “The collars were programmed to collect GPS data at 4 Hz (i.e. 345,000 data points/day) and accelerometer data at 10 Hz (i.e. 862,500 data points/day).” [8]
- Data storage/transmission. The description of the technology used to transmit data (e.g. wireless transmission such as Bluetooth, Wi-Fi or Radiofrequency, or manual data transmission) is relevant because it can have an influence on cow behaviour: data that are automatically transmitted do not need intervention on the animal, whereas data manually downloaded (USB, SD-card) may disturb the animal. On the other hand, wireless data often entail a loss of data. If data loss occurs, it would be good to quantify and specify when and how much data are missing. A second step to describe the sensor consists in describing the data it provides, as every system has its own way to process, deliver, present, aggregate, etc. the data.
Example 1: On MSR RumiWatch pressure noseband, used to register chewing or ruminating behaviour, data are stored on a SD-card [9], [10]. If there is a need to collect the data during the trial, it could create a disturbance in cow behaviour, as the halter has to be unmounted to download the SD-card through a computer.
Example 2: “The collar-mounted accelerometers […] measurements were gathered once a second using wireless data acquisition network […]. Data packets were then sent to a PC.” [11]
Example 3: “Data were downloaded every 15 d using eCow handset (smartphone + antenna) with eCow android application.” [4]
- Nature and type of data collected: The nature of the data obtained using sensor varies: acceleration, voltage, weight, inclination, position, and duration. Moreover, some sensors can provide already processed data, like activity levels or direct behaviour (e.g. ingestion or rumination), or simply filtered or averaged values. Thus, a proper description of the nature (including units) and the type (raw vs processed) is required. Data processing will be described later.
Example 1: “The data recorded by the GPS included the spatial position of the animal on the earth-centered earth-fixed coordinate system (X-, Y- and Z-axis coordinates in cm) the time as in the GPS system, and the 3-dimensional travel speed (cm/s).” [8]
Example 2: “Five variables were recorded by the accelerometers over each epoch: average acceleration in each of the three axes (XavgG, YavgG, ZavgG), Vector Magnitude Average (VMavgG), and Vector Magnitude Max (VMmaxG). Average axis acceleration (XavgG, YavgG, ZavgG) and Vector Magnitude Average (VMavgG) were calculated by summing the inputs (100 samples/s) and dividing by the specified reporting interval (3, 5, or 10 s). Vector Magnitude is calculated by
\(\small \text{Vector Magnitude} = \sqrt{XavgG^2+ YavgG^2+ZavgG^2}\)
The VMmaxG is simply the highest combined axis instance per reporting interval.” [12]
- Data rate and timestamp/dating: Data rate can be rather different to sampling rate, mainly in cases where data are processed. It can be expressed in terms of frequency, epochs, etc. A precise description of time- and date-related information is also necessary, as it has repercussions on data analysis, and especially in data comparison with gold standard. Indeed, data can be summarized in UTC (Coordinated Universal Time), GMT±h (Greenwich Mean Time), or collected with a non-synchronized clock (e.g. chronometer and sensor synchronized at the beginning of the trial.
Example 1: “The clocks of the observer, the video recording system, and the sensors were synchronized at the start and at the end of the observation period so that observation data could be aligned accurately with the tri-axial accelerometer data retrieved from the sensors.” [7]
Example 2: “The device is connected to Ethernet to ensure a perfect clock synchronisation using the Network Time Protocol (NTP), dating in the epoch time system.” [3]
- Data processing: Some pieces of information are helpful to interpret the dataset. The point here is not to describe precisely the algorithm used, but more to describe its impact on the dataset. Data can be acquired by a single-shot measurement, but it can also be averaged, filtered, or processed by an algorithm, and thus it can introduce a delay in – for example – data presentation that has to be characterized.
Example 1: Axel Medria normalized dataset present data obtained by the identification of the main behaviour registered during the previous 5 min. For example, if the dataset indicates that the cow was grazing at 0815 h, it means that between 0810 h and 0815 h, the algorithm has calculated that the cow was mainly grazing during this period.
Example 2: Various filters (e.g. Kalman filter, median filter) can be applied to clean the data provided by RTLS, as Pastell [13] does, leading to a reduced data output or data capturing frequency.
- Data calibration: Some systems need to be calibrated regularly, in order to improve the matching between the physical measurement and the data it produces. This calibration schedule needed has to be expressed in frequency (e.g. monthly).
Example: Weighing scales, like those used in BioControl weighing trough, which basically measure voltages and convert it in weights, need to be calibrated at least monthly to ensure that there is no deviation into the converting process.
For some sensors, a ‘training’ period can also be necessary. Devices might indeed require an auto-calibration or recalibration period, e.g. an accelerometer need to ‘find’ earth acceleration to determine the real acceleration direction it records. Manufacturers often provide this information, and a validation study needs to respect at least these minimum requirements.
Example 1: CowView RTLS used fixed tags to auto-evaluate its performance [3], [13], [14].
Example 2: “It records both dynamic accelerations, related to changes in the movements of the sheep and static accelerations (−9.8 m s−2) caused by earth’s gravity.” [1]
- Theoretical accuracy, resolution and range of measurement: Manufacturers can provide information on the precision of the measurement made by the sensor. When it is available, it is relevant to characterize what can be expected from the device in use. It can also provide useful information in the discussion of the results obtained from the validation trial.
Example 1: CowView RTLS system is given to have an accuracy of 50 cm in detecting the position of an individual in the barn [15], based on the capabilities of its electronic. Meunier [3] have shown that in real condition, it could be better, with a 16 cm precision to detect a precise activity (eating salt).
Example 2: “The accelerometer measured a range of ±3.2 g with an accuracy of 0.075 g.” [16]
B – Test environment
This part will provide a description of the important factors to be aware of, both from an animal behaviour point of view and from a technologal point of view. The environment of the animals can have important impact on the results. Ideally, the range of environments in which the tool will provide valid results should be described. Because this can hardly be done, the tool should at least be validated for later use in the same type of environments. A large number of environmental factors can affect the behaviour of cattle, and since many of the sensors in use are measuring the movement of different parts of the body of the animal, it is important to keep the animals in an environment that allows for the movements that later on is in focus. Furthermore, since direct observations or video recordings very often are used as gold standard, the environment should allow for proper observations of the behaviour of the animals. Thus a clear description of housing (including size, floor type, bedding, cubicle type, feeding area etc.), milking, group size, climate conditions etc. should be included in the materials and methods section of a validation study.
Example 1: “Cows were housed in free stalls with mattress and sawdust bedding and concrete slatted floors. They were milked twice daily and supplied with fixed amounts of concentrates and ad libitum roughage.” [17]
Example 2: “Lactating cows were kept in a loose-house system with slatted floor and cubicles with mattresses (Comfi Cushion, with permeable rubber, Egtved, Denmark). The facility was equipped with a free cow traffic automatic milking system (DeLaval, Tumba, Sweden) with an automatic milking unit for each section. Dry cows were kept in pens with deep bedding in the lying area and with slatted floors in front of the feeders.” [18]
From a technological point of view, it is important to consider that some environmental conditions can influence the quality of the dataset. Some information can be relevant to assess that pitfalls have been avoided or taken into account during the validation study. Respect of environmental condition of use of the sensor and its electronics is important. As every electronic devices, sensors are made to operate under given environmental conditions. The sensor first can be sensitive to physical disturbance (e.g. altitude can influence the measurement made by an accelerometer as it modifies its reference acceleration due to a different gravity) and the on-board electronic is also designed to run under appropriate climate conditions (e.g. electronic components are given to run in a precise range of temperature, clock and sensor’s precision are often deviating with temperature). This information is often provided by the manufacturer too. It may also imply that a record of the environmental conditions during the study should be recorded and reported.
Example: Medria recommend to use Axel accelerometers between −20° C and +55° C, at an altitude lower than 2,000 m asl.
Some information can be relevant to assess that pitfalls have been avoided or taken into account during the validation trial. Here are some examples of pitfalls that have been avoided before the experiment, or discovered a posteriori, based on users’ feedback.
Example 1: When a cow is lying on one side, is the CowView sensor masked by the cow posture or by the cubicle structure? When a cow is in the milking parlour, which is not covered by the antennas, what activity is it associated with?
Example 2: Accelerometers interpret feeding behaviour using the inclination of the cow head. In case cows are fed with an automatic concentrate feeder, the angle can be insufficient to detect a feeding behaviour when the animal eats concentrate. Thus, using accelerometers with such feeding systems can lead to poor results in the validation process. This can also be the case with animals grazing in high grass or animals fed on a weighing trough.
Example 3: Gyroscope based sensors are very sensitive to metallic environment, and motions recorded with such devices can be false, whereas UWB signals are absorbed by wood, which can lead to a distortion of the signal.
Example 4: MSR RumiWatch pressure noseband is very sensitive to low temperature and altitude. As they work with propylene glycol, there is a need to ensure that its density is stable and that it is in a liquid state.
In every case encountered, it is essential to observe and annotate abnormal events with the aim to be able to discuss the results.
Example 1: D’Andrea [19] encountered issues of misclassified behaviours due to prolonged activity of body scratching by one cow with the leg equipped of a pedometer.
Example 2: Feeding visit at the weighing trough could be allocated to the wrong animal due to a smart ‘animal thief’, able to eat over the gate.
C – Ethic and need for permission
Remember to get the permissions needed for the handling and care of the animals included in the validation, and considere whether the impact on the animals’ welfare can be justified. These considerations should also include facts about the effects of longer terms use.
D – Animals and feeding
The type of animal (species, age, size, feeding regime, etc.) can have important impact on the results. Ideally, the range of animal types for which the tool will provide valid results should be described. Because this can hardly be done, the tool should at least be validated for later use with the same type of animals. Therefore, the description of the animals included in the validation needs to include minimum information about the animals and their feeding.
Several animal characteristics to consider during the validation process will help for the interpretation of results:
- Breed: defining if sensors are tested in dairy and beef ruminants is important since they have different routines that may entail differences in the validation process.
- Physiological status: animals will behave differently depending of their physiological status (i.e., lactating or not, high vs. low producing milk cows, unhealthy animals). Therefore, including animals in different physiological stages or defining them will be required for the validation process.
- Animal age: young and adult ruminants have different sizes and routines that may alter the results of the validation or the adaptability of the sensor to the animal. Thus, young and adult animals will require different validations processes.
Example 1: Eating time may differ between high and low producing cows; thus a validation with the use of low producing cows may not tell anything about the validity for cow with a longer eating time.
Example 2: Calves may run and jump more than older animals; thus, a device for measuring movement may not show the same results on calves and cows.
- Type of diet: the type of feeds animals have access to (i.e., TMR, hay, pasture) should be described to help the interpretation of the validation process.
Example: A sensor that measures eating at pasture may not measure eating in a barn due to differences in the movements of cows when eating.
For the number of animals and the number of observations to be included in the study, see chapter on sample size.
E – Position of the sensor on the animal and need for a habituation period
The position of the sensor on the animal is very important, because in many cases, it is highly correlated with the measurement, and thus with the studied behaviour. A complete description of the position of the sensor should include at least:
- Anatomic indication (e.g. retro-mandibular microphone, leg- or neck-mounted accelerometer, reticulum pH boluses, ear-tag, etc.)
- Symmetry (e.g. right/left, front/rear) if relevant.
Example: “accelerometers were attached to the lateral face of the rear leg, just proximal to fetlock” [12]
In some cases, it could be meaningful to describe the orientation of the sensor. For example, with an accelerometer, indicating where the x-, y- and z-axis are pointing can be essential to understand the data.
Example: “During the experiment, the bold end of the logger always pointed towards the animal’s head and the truck ridge pointed to the top. Thus the instrument’s X-axis corresponded to the vertical dimension, the Y-axis corresponded to one horizontal dimension, measuring the acceleration sidewise to the left and right, and the Z-axis corresponded to the second horizontal dimension measuring the acceleration forwards and backwards.” [2]
In general, several questions have to be addressed while choosing how to equip the animal with a particular sensor, and could help in describing and justifying how the sensor is placed on the animal.
- Which sensor for which position and for which behaviour?
Example 1: Benaissa [7] showed that leg-mounted accelerometers are more accurate than neck-mounted accelerometers to detect lying behaviour, whereas it is the opposite in identifying feeding behaviour.
Example 2: For RTLS tag, “the dorsal position was chosen to minimize possible shielding of the signal by the body of the cow.” [13]
- Is there a risk of negative interaction if several sensors are placed on the same mounting system? Does the sensor measure the animal or the device (i.e. collar) behaviour? How to ensure a stable position of the sensor over time?
Example 1: CowView weighted-collar are designed to receive a CowView tag, and ensure its positioning on the top of the cow neck. What would happen if we had a retro-mandibular microphone on this collar? Would the RTLS tag stay at the right place?
Example 2: Some authors have shown that for certain sensors, tightly or loosely mounted collars have no significant impact on the quality of the dataset provided by an accelerometer [20].
- Is there a known risk of injury by the sensor if placed in a certain position/on certain mounting system? How can it influence the natural behaviour of the animal?
Example: RumiWatch halter is less adapted to young bulls. They may over-express scratching behaviour because the halter embarrasses them.
Lastly, the user needs to describe whether a habituation period is required by the animal (do not confuse with the training period of the sensor, as has previously been described). This can be particularly relevant in case mounting the sensor affects animal behaviour for a few days.
Example 1: For pedometers, D’Andrea [19] applied a 2-day habituation period, allowing cows to return to a normal activity. Rombach [9] proceeds similarly with RumiWatch halters, which needed 4 d of habituation for the animal.
Example 2: While giving access to feed into a weighing trough, cows may need a few days to learn the gate access process.
F – How to measure/record the ‘gold standard’
The ‘gold standard’ is the best estimate of the true behaviour performed or true status of the animal that is used to validate the accuracy, precision, etc. of the output of the sensor. The quality of the ‘gold standard’ is therefore very important for the outcome and sets the limit for the quality of the validation. It may be difficult to get ‘gold standards’ that are correct/true for some type of behaviour. It is relatively easy to define whether a cow is standing or lying, but determining from either direct observation or video recordings whether a cow is walking, standing or even taking a step can be much more complicated. Feeding behaviour is another example, feeding can be defined as when a cow is chewing or it can also be defined as when a cow has the head above the feeder. The choice of definition of the ‘gold standard’ may have a huge impact on the outcome of validation. Furthermore, sometimes other types of equipment may provide better ‘gold standard’ than observations of the behaviour. For instance, may brush rotation provide a better estimate of grooming towards a brush than direct observation of the behaviour? Therefore, providing a careful description on how the ‘gold standard’ is obtained is important. Furthermore, there is a number of other factors to consider:
- Description of the behaviour: How does the behaviour in question look like, if including drawings or pictures of the behaviour/position of the animal?
- The choice of data sampling method, duration, etc. should match the question that is addressed. If the question is whether a specific sensor measures rumination per day, observations of ruminations per day may be enough, and here minor deviations in when rumination start and stop may not be important. If the question is: can the output from this sensor tell me exactly when a cow starts/stops to ruminate, then exact recordings of rumination including start and stop time stamps is needed.
- The duration of the sampling as the ‘gold standard’. In which time windows should data be collected and for how long on each animal.
- Synchronization of time between recording ‘gold standard data’ and sensor output.
- Intra- and inter-observer repeatability should be addressed. Well trained observers are needed; and it is important to check intra- and inter-observer repeatability and report that along with the results.
G – Sample size and analysis
A validation of the output of a sensor or device to automatically measure cow behaviour should include both information about how accurate is the measure (how close to the true value) and how precise is the measure (will repeated measures show the same). Furthermore, there might be a variation in the accuracy and precision depending on the level of the response (e.g. accuracy in the measures of short lying periods may be larger than accuracy in longer lying bouts). Most validations include an estimate of the average accuracy and precision in terms of an expression of the agreement between the gold standard and the automatic measure [21]. It will be more useful if information about the variation at different response levels is reported (Figure 2). Since we are dealing with live animals, the accuracy and precision may also vary due to variation between animals, e.g. the same sensor may work really well on some cows but not on other cows due to, for instance, slight differences in the position of the sensor. Therefore, it is not a simple task to choose how many animals and how many repeated measures per animal should be included in the validation. In order to choose the sample size consider the following:
- How is the data distributed and what are the highest and lowest values that you wish to estimate using the equipment?
- Do the manufacturers suggest a lowest and highest value the device can measure and what is the resolution?
- Decide, based on 1. and 2., which interval the validation should cover, and the resolution of the ‘gold standard’ data.
- Decide whether the validation should give an estimate of the average agreement or better also report the variation in the agreement over the interval the validation shall include.
- Perform appropriate power analysis, based on 1. or 2. and best estimate of the variation in the response, both within and between animals at a given response level.
It is beyond this guideline to give exact information about power analysis, since this may vary depending on the type of data and the questions that the validation shall address and the methods of analysis. We therefore suggest that you either contact a statistician or study the literature about power analysis.
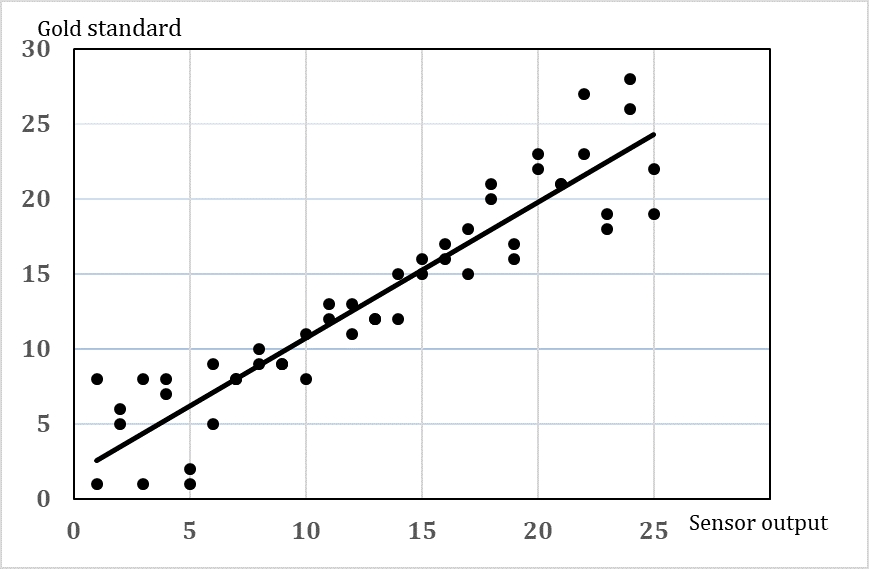
Basically, the analysis of the data should give information about the agreement between the gold standard and the behaviour recorded with the sensor (e.g. the sensor data should predict the behaviour of the animal). Previously, simple correlations coefficient has often been used, but this cannot be recommended. The Bland-Altman method [22], [23] has been used widely in medical research. The most appropriate choice of analysis depends on the type of data (e.g. distribution, continuous or categorical). Another approach is linear regression analysis including a confidence interval. An intercept of 0 and a slope close to 1 will indicate a good agreement, and a proper confidence interval can show the variation at different response levels. Whether this method can be used depends on whether the assumptions are fulfilled.
- Plot and check the quality of the data, give a clear description of data that eventually are omitted from the data included in the analysis and any other pre-handling of both ‘gold standard’ data and automatically collected data.
- Check the distribution of the data.
- Check the assumptions for choice of statistical model are fulfilled.
H – Robustness of the system in use
Besides the actual validation of the output from a specific device, it will be helpful for other users to have as much information as possible on the following:
- Effects on the animals: Any injuries on the animals derived from the devices depending on how and where on the animal the sensor is attached, and for how long the sensors have been attached, to the animal to estimate the length of time a specific sensor can be used.
- Drift in output over time: Some sensors may show a drift for instance in the timestamp or the actual output from the sensor. This type of information should be provided by the manufacturer but, in some instances it may be lacking, any information about this will help other users.
- Need for calibration: This type of information should be provided by the manufacturer but, in some occasions, it may be lacking, thus any information about this will help other users.
- Maintenance of the sensor and the system is needed.
References
[1] Giovanetti V, Decandia M, Molle G, Acciaro M, Mameli M, Cabiddu A, et al. Automatic classification system for grazing, ruminating and resting behaviour of dairy sheep using a tri-axial accelerometer. Livest Sci. 2017;196:42-48. DOI: 10.1016/j.livsci.2016.12.011[2] Moreau M, Siebert S, Buerkert A, Schlecht E. Use of a tri-axial accelerometer for automated recording and classification of goats’ grazing behaviour. Appl Anim Behav Sci. 2009;119(3-4):158-70. DOI: 10.1016/j.applanim.2009.04.008
[3] Meunier B, Pradel P, Sloth KH, Cirié C, Delval E, Mialon MM, et al. Image analysis to refine measurements of dairy cow behaviour from a real-time location system. Biosys Eng. 2018;173:32-44. DOI: 10.1016/j.biosystemseng.2017.08.019
[4] Villot C, Meunier B, Bodin J, Martin C, Silberberg M. Relative reticulo-rumen pH indicators for subacute ruminal acidosis detection in dairy cows. Animal. 2018;12(3):481-90. DOI: 10.1017/S1751731117001677
[5] Ledgerwood DN, Winckler C, Tucker CB. Evaluation of data loggers, sampling intervals, and editing techniques for measuring the lying behavior of dairy cattle. J Dairy Sci. 2010;93(11):5129-39. DOI: 10.3168/jds.2009-2945
[6] Müller R, Schrader L. A new method to measure behavioural activity levels in dairy cows. Appl Anim Behav Sci. 2003;83(4):247-58. DOI: 10.1016/S0168-1591(03)00141-2
[7] Benaissa S, Tuyttens FAM, Plets D, de Pessemier T, Trogh J, Tanghe E, et al. On the use of on-cow accelerometers for the classification of behaviours in dairy barns. Res Vet Sci. 2019;125:425-33. DOI: 10.1016/j.rvsc.2017.10.005
[8] González LA, Bishop-Hurley GJ, Handcock RN, Crossman C. Behavioral classification of data from collars containing motion sensors in grazing cattle. Comput Electron Agric. 2015;110:91-102. DOI: 10.1016/j.compag.2014.10.018
[9] Rombach M, Münger A, Niederhauser J, Südekum KH, Schori F. Evaluation and validation of an automatic jaw movement recorder (RumiWatch) for ingestive and rumination behaviors of dairy cows during grazing and supplementation. J Dairy Sci. 2018;101(3):2463-75. DOI: 10.3168/jds.2016-12305
[10] Werner J, Leso L, Umstatter C, Niederhauser J, Kennedy E, Geoghegan A, et al. Evaluation of the RumiWatchSystem for measuring grazing behaviour of cows. J Neurosci Meth. 2018;300:138-46. DOI: 10.1016/j.jneumeth.2017.08.022
[11] Martiskainen P, Järvinen M, Skön JP, Tiirikainen J, Kolehmainen M, Mononen J. Cow behaviour pattern recognition using a three-dimensional accelerometer and support vector machines. Appl Anim Behav Sci. 2009;119(1-2):32-8. DOI: 10.1016/j.applanim.2009.03.005
[12] Robert B, White BJ, Renter DG, Larson RL. Evaluation of three-dimensional accelerometers to monitor and classify behavior patterns in cattle. Comput Electron Agr. 2009;67(1-2):80-4. DOI: 10.1016/j.compag.2009.03.002
[13] Pastell M, Frondelius L, Järvinen M, Backman J. Filtering methods to improve the accuracy of indoor positioning data for dairy cows. Biosys Eng. 2018;169:22-31. DOI: 10.1016/j.biosystemseng.2018.01.008
[14] Veissier I, Mialon MM, Sloth KH. Short communication: Early modification of the circadian organization of cow activity in relation to disease or estrus. J Dairy Sci. 2017;100(5):3969-74. DOI: 10.3168/jds.2016-11853
[15] Tullo E, Fontana I, Gottardo D, Sloth KH, Guarino M. Technical note: Validation of a commercial system for the continuous and automated monitoring of dairy cow activity. J Dairy Sci. 2016;99(9):7489-94. DOI: 10.3168/jds.2016-11014
[16] Chapinal N, de Passillé AM, Pastell M, Hänninen L, Munksgaard L, Rushen J. Measurement of acceleration while walking as an automated method for gait assessment in dairy cattle. J Dairy Sci. 2011;94(6):2895-901. DOI: 10.3168/jds.2010-3882
[17] Kok A, van Knegsel ATM, van Middelaar CE, Hogeveen H, Kemp B, de Boer IJM. Technical note: Validation of sensor-recorded lying bouts in lactating dairy cows using a 2-sensor approach. J Dairy Sci. 2015;98(11):7911-6. DOI: 10.3168/jds.2015-9554
[18] Henriksen JC, Munksgaard L. Validation of AfiTagII, a device for automatic measuring of lying behaviour in Holstein and Jersey cows on two different bedding materials. Animal. 2019;13(3):617-21. DOI: 10.1017/s1751731118001623
[19] D'Andrea L, Guccione J, Alsaaod M, Deiss R, Di Loria A, Steiner A, et al. Validation of a pedometer algorithm as a tool for evaluation of locomotor behaviour in dairy Mediterranean buffalo. J Dairy Res. 2017;84(4):391-94. DOI: 10.1017/S0022029917000668
[20] Oudshoorn FW, Cornou C, Hellwing ALF, Hansen HH, Munksgaard L, Lund P, et al. Estimation of grass intake on pasture for dairy cows using tightly and loosely mounted di- and tri-axial accelerometers combined with bite count. Comput Electron Agr. 2013;99:227-35. DOI: 10.1016/j.compag.2013.09.013
[21] Borchers MR, Chang YM, Tsai IC, Wadsworth BA, Bewley JM. A validation of technologies monitoring dairy cow feeding, ruminating, and lying behaviors. J Dairy Sci. 2016;99(9):7458-66. DOI: 10.3168/jds.2015-10843
[22] Altman DG. Practical Statistics for Medical Research. London, UK: Chapman Hall; 1997.
[23] Bland JM, Altman DG. Statistical methods for assessing agreement between two methods of clinical measurement. Lancet. 1986;1(8476):307-10. DOI: 10.1016/S0140-6736(86)90837-8