Antibiotic therapy in patients with renal impairment
1 Department Internal Medicine 1, Nephrology, University Hospital Ulm, Ulm, Germany
Abstract
Every second drug needs dose adjustment to kidney function. The Cockcroft and Gault formula gives an estimate of the individual kidney function whereas the CKD-EPI and other formulas state only the standardized GFR. Pharmacokinetics should be considered to avoid accumulation and toxic drug effects. Pharmacodynamics should be considered to avoid sub therapeutic under dosage. High peak concentrations are the target for antibiotics with a concentration-dependent action (gentamicin, amikacin, levofloxacin, ciprofloxicin, daptomycin, linezolid, colistin and most anti-fungal drugs). High trough concentrations are the target for antibiotics with time-dependent action (ampicillin, piperacillin, cefazolin, ceftazidime, meropenem, clarithromycin, doxycycline, vancomycin and all anti-viral drugs). From such pharmacokinetic and pharmacodynamic principles the following recommendations might be derived for the adjustment of antimicrobial drugs to the kidney function.
- Start anti-infective treatment within 1 hour.
- Use a loading dose (Dstart) – at least the normal or even a higher bolus dose.
- If the GFR is above 60 ml/min no dose adjustment is needed.
- Dose adjustment (D) should follow not before day 3 of the antibiotic therapy.
- If the estimated half-life is less than the normal administration interval no dose reduction should be made, but use at maximum the half-maximum standard dose.
After hemodialysis a supplementary dose should be given to replace the removed fraction. During continuous renal replacement therapy usually a normal or near normal dose might be advisable. In the most critical patients, the continuous infusion of anti-infective drugs might allow for higher and more efficacious dosing without an increased risk of toxicity (meropenem, piperacillin, oxacillin, vancomycin, acyclovir).
Abbreviations
AUC: area under the concentration time curve (h x mg/l)
BSA: body surface area (sqm)
CE05: threshold concentration producing 5% of Emax
CE50: concentration producing 50% of maximum effect Emax
CE95: ceiling concentration producing 95% Emax
Cl: drug clearance (l/h)
CLCrea: creatinine clearance (ml/min)
Cpeak: peak steady state concentration (mg/l)
Ctrough: trough steady state concentration (mg/l)
D: dose (mg)
E: effect
F: bioavailable fraction
FR: fraction eliminated by hemodialysis
fren: fraction eliminated by renal route
GFR: glomerular filtration rate (ml/min)
IR: infusion rate (mg/h)
MIC: minimal inhibitory concentration (mg/l)
PB%: plasma protein binding (%)
R: accumulation factor
sCrea: serum creatinine (µmol/l)
t: time (h)
Tau: administration interval (h)
Tceiling-threshold: ceiling-to-threshold time (h)
T1/2: half-life (h)
Vd: volume of distribution (l)
Summary of recommendations
For kidney failure with a GFR<60 ml/min the following recommendations could be made.
- The individual GFR and the individual half-life should be estimated based on the fraction eliminated by the renal route (fren) – or even better, by interpolating between the half-life values for normal (T1/2norm) and failing (T1/2fail) kidney function.
- The dose should be adjusted by using the eliminated fraction rule (Dettli 3). This means that the usual target is the normal peak.
- Antibiotics with a concentration-dependent action need a high ceiling (CE95) meaning that peak concentrations (Cpeak) should be selected as the target but an extension of the administration interval is less critical
- Antibiotics with a time-dependent action have a high threshold (CE05) meaning that a high trough concentration (Ctrough) should be selected as the target. Thus the administration interval must not be prolonged – at least not to more than one half-life. The dose should be reduced if the individual half-life is longer than the administration interval.
- Most practically and according to Kunin, the maintenance dose is one half of the normal dose when the administration interval corresponds to one half-life.
Under renal replacement therapy the risk of insufficient under dosage is even higher than the risk of toxic overdose.
- The antibiotic dose for continuous renal replacement therapy (D CRRT) should be derived from the total creatinine clearance (CLcrea). If kidney function is deteriorating or improving the kinetGFR could be used to give an estimate of how residual kidney function and renal replacement impact on drug kinetics.
- For patients treated with intermittent hemodialysis the rule is to administer the antibiotics after dialysis (D HD) just to maintain effective drug levels also between the procedures. The dose after dialysis corresponds to the normal loading dose in most cases.
- If the antibiotic is administered before dialysis a higher dose is needed that must preemptively replace the fraction removed by dialysis (FR).
- In cases with suspected overdose an additional hemodialysis could be recommended to remove the excess amount from the body.
1 Introduction
In patients with impaired kidney function one must be aware of two errors when using antibiotics for treatment of infectious diseases. The first error emerges from drug toxicity due to excessive accumulation. One example is cefepime where neurotoxicity occurs in up to 20% of kidney patients – and some cases even die [1]. The other error results from underdosage due to overcautious dose adjustment. Former examples for underdosage were vancomycin and ciprofloxacin [2]. The dosing information of the producer in the package inserts follow often the proportional dose reduction rule by Dettli. Such dose recommendations may lead to inadequate exposures of ceftolozane-tazobactam, ceftazidime, cefotaxime, ciprofloxacin, erythromycin, imipenem, levofloxacin, and teicoplanin in patients with kidney dysfunction [3].
To avoid the first error, namely accumulation, one needs to apply pharmacokinetic principles. To avoid the second error, namely underdosage, one needs to apply pharmacodynamic principles. Both risks increase with the severity of the infectious affection. The main reason for drug accumulation is impaired kidney function. Kidney dysfunction can occur as a typical complication in the most critical cases under intensive care conditions. Mainly in the intensive care setting pharmacokinetic and pharmacodynamic considerations are helpful to improve antibiotic therapy.
2 Methods
A systematic literature search was continuously performed during the last 30 years in PubMed with the following keywords: pharmacokinetics, pharmacodynamics, clearance, volume, half-life, hemodialysis, hemofiltration and the following limitations: volunteers, patients, clinical studies. A total of 50,000 parameters were recorded from 10,000 publications in the NEPharm database [4]. The following statements on antibiotic dosing can be rated only with an evidence level LE of 3 or less and the strength of recommendations can be graded only with a C according to the system used in the EAU guidelines. In each patient, the decision about benefit or burden of the antibiotic dosing remains the responsibility of the treating physician.
Kidney function
Drug elimination depends on kidney function. Therefore, an estimate of kidney function is needed to derive the appropriate dosage. The acute kidney injury (AKI) is distinguished from chronic kidney disease (CKD). For dose adjustment, not the creatinine but the glomerular filtration rate (GFR) gives the established measure in patients with kidney dysfunction.
The GFR can be used as a basis for estimating the effect of kidney dysfunction on drug pharmacokinetics. Today, the estimated GFR (ml/min) is provided by most clinical chemistry labs from the measured serum creatinine with the CKD-EPI formula. However, the output is a standardized eGFR in ml/min per 1.73 sqm body surface area. Accordingly, the individual GFR is less or more than the eGFR depending on the body surface area (BSA). That means the individual weight (kg) and height (cm) must be respected.
Since the individual BSA is rarely calculated in the ICU, the advantage of the Cockcroft and Gault formula (C&G) can clearly be seen. The C&G equation considers not only the age (years) but also the weight (kg) to estimate the individual GFR. The most convenient C&G formula holds also for the new calibrated enzymatic creatinine (mcmol/l) and it is a coefficient-free version of the original C&G formula [5]. This GFR estimate can be easily memorized and calculated in mind.
However, the acute kidney injury (AKI) is likely the bigger problem in the intensive care medicine than the CKD. The staging of CKD is based on GFR whereas the staging of AKI is based on the serum creatinine. It is a great advantage that also for AKI with changing kidney function as in the ICU a creatinine-based estimate of the GFR exists namely the kinetic GFR [6]. The kineticGFR is derived from creatinine production (GFR x sCrea = creatinine elimination), the creatinine distribution volume (Vd = 0.65 x Weight) and the maximum possible change in serum creatinine (delta Crea in µmol/l) within 24 hours (delta t in hours). Accordingly, a simplified version for the kinetGFR estimate can be derived from the C&G formula.
If the creatinine rises every 12 hours by 50 µmol/l to 200 µmol/l, a 60 years old patient with a weight of 75 kg will have a decline in the kinetGFR from 65 to 43 ml/min. Conversely, if the creatinine improves every 12 hours by 50 µmol/l to 150 µmol/l, the kinetGFR rises from 36 to 48 ml/min.
Such a practical estimate of kidney function is helpful for drug dose adjustment in AKI. There is, however, not only the impaired kidney function due to AKI or CKD but also the case with overhydration and augmented renal clearance. The AKI and CKD usually need a drug dose reduction, but overhydration and augmented renal clearance need a higher dose. This is especially true for pregnant women, young patients with cystic fibrosis/ mucoviscidosis, patients with burns and patients in the hyperdynamic state of sepsis – usually temporary and variable conditions.
Augmented renal clearance only needs a higher maintenance dose. In contrast, the excessive volume expansion due to overhydration needs both, a higher loading dose and a higher maintenance dose – just as with weight-based dosing in children.
Kidney dysfunction and pharmacokinetic parameters
To correlate drug elimination with kidney function, originally, a linear dependence of the elimination rate constant (Ke) from creatinine clearance has been demonstrated [7]. The elimination rate constant is the inverse half-life where it holds (ln(2)=0.693).
Today, such a linear dependence from kidney function (GFR), can be found for the clearance (Cl), the volume (Vd), the plasma binding (PB%) and the half-life (T1/2). If the specific parameters for the extremes of normal and failing kidney function have been determined, the respective individual parameter values can be estimated by interpolation.
The changes in half-life and clearance are usually inversely proportional since changes in volume and binding are much less compared to changes in clearance and half-life.
If the clearance is reduced to 10 % the half-life will increase by the factor of 10 as can be seen with the example of amoxicillin.
Accumulation kinetics
To derive dose adjustment rules, the accumulation kinetics must be considered: If a drug is given with a constant administration interval, the steady state will be reached after 4.32 half-lives (exactly to 95 %). In the steady state the concentrations will oscillate between the peak (Cpeak) and the trough concentrations (Ctrough) depending on half-life (T1/2) and administration interval (Tau).
For repetitive dosing, the average concentration (Css=Caverage) is the steady state concentration which is the logarithmic mean of peak and trough values.
The average concentration can best be derived from the drug clearance (Cl) especially for the case of continuous infusion. The infusion rate (IR) is the dose (D) that is administered continuously within the time of infusion (T).
An example is meropenem, where the average concentration is the target concentration of 8 to 16 mg/l [8].
3 Results for dose adjustment
When treating patients with infection, it is important to start immediately and not to underdose as Paul Ehrlich already in 1913 stated: “Frapper vite et frapper fort”. If the clinical diagnosis of an infection has been made, the first step is to withdraw material for microbiology from urine and blood. But immediately after securing the material the antibiotic treatment should be initiated without a delay and within 60 minutes caled the “golden hour” [9]. The immediate therapy usually begins with an empirical or calculated antibiotic regimen depending on local experience. The specific antibiotic treatment can be modified later when the microbiological findings are available. The antibiotic treatment starts with a loading dose that primarily is the normal dose (Figure 1). However, in the intensive care medicine, patients frequently are overhydrated and need an even higher loading dose.
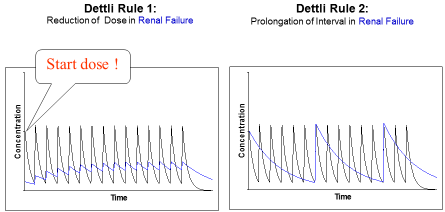
Figure 1: Proportional dose adjustment: either the dose is reduced or the interval is
extended. Dettli 1 needs a loading dose. In doubt Dettli 2 should be preferred.
Thus, also for normal kidney function the loading dose can be higher than the normal dose (e.g. teicoplanin). For kidney dysfunction, the loading dose (Dstart) must be derived from the accumulation factor (R) and normal dose (Dnorm).
To adjust the maintenance dose, 3 different rules are available (Figure 2). Luzius Dettli was not only the first to show the linear dependence of drug elimination from kidney function. He also demonstrated how the drug dose can be adjusted in proportion to the reduced drug elimination. There are, however, two possibilities to proportionally adjust the dosing (Figure 1): one can either reduce the maintenance dose (Dettli 1) or extend the administration interval (Dettli 2).
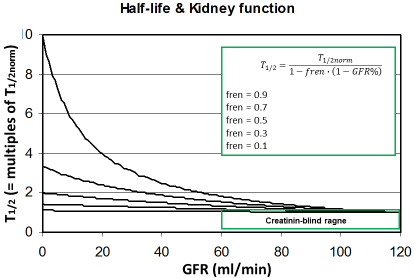
Figure 2: The half-life increases with decreasing kidney function
depending on the fraction eliminated by the renal route (fren). Since
this rise is still uncritical in the creatinine-blind range the drug dose
must not be reduced when the GFR is >60 ml/min.
Dettli derived the dose adjustment diagram from the nonrenal fraction (Qo). This Qo is complementary to the fraction eliminated be the renal rout (fren). The fren is found in the literature most easily since it must be stated before approval of a new drug by the authorities (FDA, EMA).
The fraction eliminated be the renal route can be estimated from the amount eliminated in urine (A urine) under normal conditions.
This might help to predicting the individual kinetics of new drugs when more data are not available. It can be predicted that those drugs will need dose adjustment to kidney function where the fren is high since kidney dysfunction will impact the half-life (Figure 2). On the other side, it might be concluded that a dose adjustment generally will not be needed if the GFR is 60 ml/min or more. The most universal form of the Dettli dose adjustment rules can be derived from this fraction eliminated by the renal route (fren).
This solution applies also to the case of augmented renal clearance.
The other, however, more frequent problem occurs when kidney function is impaired and one of the 3 Dettli rules applies. If data are available, the dose adjustment should be based on the real parameters estimated for normal (T1/2norm) and failing kidney function (T1/2fail) since the fren is a less reliable parameter.
Dettli 1: The dose is reduced in proportion to the reduced clearance or in reverse proportion to the half-life. Which approach is selected depends on the pharmacokinetic parameter that is available. A doubling of the half-life should have the consequence to reduce the dose to one half.
The new cephalosporin is ceftolozane + tazobactam with the normal dose of 1,000+500 mg every 8 hours. Since the half-life rises from 2.5 to 36 hours, the producer recommends to reduce the dose to 100+50 mg every 8 hours (Tau = const.). This dose is absurdly low especially if no loading dose and after hemodialysis no supplementary dose are given. Instead, for patients on continuous renal replacement therapy recently a dose of 1,000+500 every 8 hours has been recommend [10].
Dettli 2: Alternatively, the administration interval is extended in proportion to the half-life or inversely to the clearance (Figure 1).
Another proportional dose reduction is the combined Dettli 1 and Dettli 2 rule that applies to continuous infusion. The infusion rate (IR) is the dose continuously administered within the time of infusion (T). If the infusion is performed for a sufficient period of time, a steady state occurs after 4.32 times the half-life, and this steady state produces the average steady state concentration (Caverage). Here the drug clearance gives a practical estimate of the elimination process since the average concentration is the ratio of infusion rate and clearance. If the average steady state concentration is the target, the infusion rate should be adjusted in proportion to the clearance.
However, when the antibiotic is administered by continuous infusion there is no immediate and sufficient concentration established. The steady state takes 4.32 half-lives to occur (C → Caverage).
Therefore, a loading dose is essential when giving the antibiotic by continuous infusion. This loading dose should be administered as a bolus within less than one hour. Frequently it has been proposed to derive the special loading dose (Dss) from the average steady state concentration. This needs the volume to be determined. Since 5 different volume terms can be identified the steady state volume (Vss) is preferred.
But this loading dose (Dss) might be insufficient as can be shown with meropenem where the volume is 24 liters. The target steady state concentration should be 4 times the MIC [8], [11]. Accordingly, the target concentration is 8 to 16 mg/l and the respective loading dose (Dss) would only be 200 to 400 mg but never in the range of the normal dose of 1,000 mg (see below).
Kunin rule: A completely different solution for drug dose adjustment has been proposed by Calvin Kunin [12]. The treatment starts with a loading dose that is the product of the normal dose (Dnorm) and the normal accumulation factor (Rnorm). In doubt the loading dose is the normal dose. Since after one half-life the drug in the body will be reduced by one half, the adjusted maintenance dose is the half normal dose and the administration interval is one half-life time. This rule makes only sense, however, if the half-life is close to or even longer than the normal administration interval.
With the Kunin rule, the recommended dose for ceftolozane + tazobactam is a loading dose of 1,000+500 mg and a maintenance dose of 500+250 mg. But the administration interval should be extended to 24 hours since the half-life is 36 hours in renal failure. Since during continuous hemofiltration the half-life is 13 hours, a dose of 1,000+500 could be given every 12 hours (see Table 1 at the end of the chapter).
Dettli 3 (=David Czock rule): The most universal dose adjustment rule is the eliminated fraction rule that has been introduced by David Czock [3]. The eliminated fraction rule originally was proposed also by Luzius Dettli but he never has put this into an equation. The eliminated fraction depends on the half-life (Figure 3).
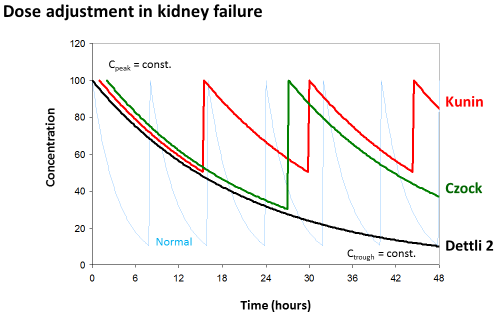
Figure 3: Eliminated fraction rule according to David Czock (=Dettli 3). The
Kunin rule is the special case where Tau=T1/2 and Dettli 2 is the special case
where both, Cpeak and Ctrough are constant.
Primarily, Dettli 3 means that the peak concentration is the target and should be constant.
But Dettli 3 can be modified by defining the new target concentrations to derive an appropriate administration interval (Figure 2).
Dettli 3 corresponds to the Kunin rule for the case where the target is the peak and the administration interval is equal to one half-life. On the other side, the Dettli 3 rule corresponds to Dettli 2 for the case that both, the peak and the trough are unchanged and taken as the targets. Then the interval must be extended in proportion to the half-life. The Dettli 3 also corresponds to Dettli 1 if the constant area under the curve AUC is the target. With Dettli 1 the administration interval and the average steady state concentration are constant. Accordingly, the peaks are less but the troughs are higher than normal, where F is the bioavailable fraction after oral dose.
The critical decision is to find the right loading dose if Dettli 1 is applied. The steady state dose (Dss) is too low for a loading. Without a loading dose, this rule is associated with a high risk to select resistant strains. As also the maintenance dose decreases (D) according to Dettli 1, the special loading dose (DstartSS) is not constant – it decreases with increasing half-life. To maintain the AUC constant, the special loading dose (DstartSS) must be derived from the special accumulation factor keeping the administration interval constant.
As with meropenem (see below), the immediate bolus loading dose (DstartSS) should be given simultaneously when starting the antibiotic administration by infusion. By this measure the average steady state concentration can immediately be established and continuously maintained. Thus, the adjusted maintenance dose (D) is the eliminated fraction of the specific loading dose that follows the Dettli 1 adjustment rule and Dettli 1 is also a special case of the Dettli 3 rule.
With Dettli 1, the adjusted maintenance dose is only 100 mg for meropenem, and the corresponding loading dose (DstartSS) would only come out to 250 mg in kidney failure. This is much less than the normal dose of 1,000 mg. From the average steady state concentration of meropenem the loading dose of 500 mg was derived since the continuous infusion produced a steady state concentration of 19 mg/l [13]. This loading dose would still be insufficient for an MIC of 8 mg/l since the target concentration must be up to 32 mg/l in such complicated cases (4xMIC). Therefore, it might be prudent to always start with a meropenem loading dose (Dstart) of 1,000 mg – at least.
According to a most recent meta-analysis the continuous infusion of piperacillin or meropenem is superior to bolus administration with an evidence level of LE 1a and a grade A recommendation. Thus, the anti-infective response is improved, but simultaneously the mortality and stay in hospital are reduced [14]. The reason and an explanation can be demonstrated below with the pharmacodynamic principles.
Pharmacodynamics
To decide on which one of the 3 Dettli rules should be applied (including Kunin and Czock) one must take into consideration also pharmacodynamic principles in addition to pharmacokinetic principles. There might be reason to speculate that some antimicrobial effects are irreversible and thus purely dose- or concentration-dependent. The irreversibility of the effect follows from the assumption that the antibiotic is killing the bacterial cells – the bactericidal effect is an irreversible process.
Most papers, however, describe the antimicrobial effect by the saturable Emax model and the sigmoid Hill equation that has been derived for receptor mediated effects [15]. Then, the effect depends on the concentration producing the half-maximum effect (CE50) and on the Hill coefficient (H). The Hill coefficient is a measure for the sigmoidicity of effect concentration curve (Figure 4).
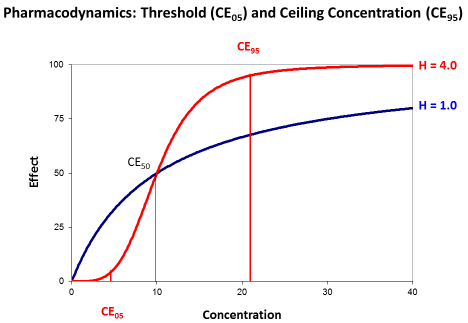
Figure 4: The sigmoid Emax model with threshold concentration (CE05) and
ceiling concentration (CE95). The concentration producing the half-maximum
effect (CE50) is independent from the Hill coefficient (H).
The concentration producing the half maximum effect gives an idea of the potency. The less the CE50 is that will be needed to already produce the half-maximum effect the higher is the potency of the drug.
The Hill coefficient indicates the sigmoidicity (Figure 4). Sigmoidicity means that at the beginning of the curve with low concentrations the effect only slightly increases and this increase is less than proportional to the rise in concentrations. Then at the CE50 there is an even over-proportionate increase, and this over proportional effect increase might make such antibiotics attractive. But for slightly higher concentrations the effect is already at maximum and saturated.
The transformed Hill equation allows to derive an exact definition of the threshold concentration (CE05) where the effect is only 5% of Emax and of the ceiling concentration (CE95) where the effect is already 95% of Emax since it holds (1.0/0.05–1.0=19).
The target concentration range may be defined between the ceiling and the threshold concentration, and the time between ceiling and threshold (Tceiling-threshold) can be derived. It depends on the half-life and the Hill coefficient [4].
This ceiling-to-threshold time is 13 hours for gentamicin since the Hill coefficient is 1.3 and the half-life is 2.0 hours. This ceiling to threshold time is also in agreement with the known postantibiotic effect of 10 to 18 hours [16]. It has long been speculated that the concentrations producing the half-maximum effect is correlated to the minimal inhibitory concentration in microbiology (CE50↔MIC). The probably more plausible concept is to identify the threshold concentration with the minimal inhibitory concentration (CE05 = MIC).
The common practice is to set the target concentration for piperacillin, meropenem, or cefotaxim at 4 times the MIC. This would mean that the target concentration is 4-times the threshold concentration. If the Hill coefficient is H=2.13, the 4-fold threshold concentration is in the range of the concentration CE50 producing the half maximum effect.
The Hill coefficient gives a theoretical explanation for the empirical statement that the target should be 4 times the MIC. The Hill coefficient also explains the difference between antimicrobials with a time-dependent effect in contrast to antimicrobials with concentration-dependent action. Antibiotics with a time-dependent effect had a Hill coefficient of H=3.0 which is significantly higher than the Hill coefficient of H=1.9 for the antibiotics with concentration-dependent action [15]. For example, gentamicin, amikacin, levofloxacin, ciprofloxicin, daptomycin, linezolid, voriconazole or colistin are classified as drugs with a concentration-dependent action but ampicillin, piperacillin, cefazolin, ceftazidime, meropenem, clarithromycin, doxycycline or vancomycin are classified as drugs with time-dependent effects [17].
Renal replacement therapy
Acute kidney injury and chronic kidney disease are frequently encountered in the intensive care unit. If conservative management fails, renal replacement therapy is required. Two different modalities of renal replacement therapy must be distinguished: continuous hemofiltration and intermittent hemodialysis. Both modalities have a considerable but different impact on drug pharmacokinetics and thus dose adjustment.
With hemofiltration as a continuous renal replacement therapy (CRRT) a measure is needed for the effect on drug elimination. The most evident approach is the total creatinine clearance since creatinine is eliminated by natural and artificial filtration.
Practically, the C&G derived kinetGFR gives a reliable estimate of the total creatinine clearance [6]. Thus, the kinetGFR indicates the impact on drug elimination for both possibilities of changing kidney function – worsening or improving and for renal replacement therapy (Figure 5).
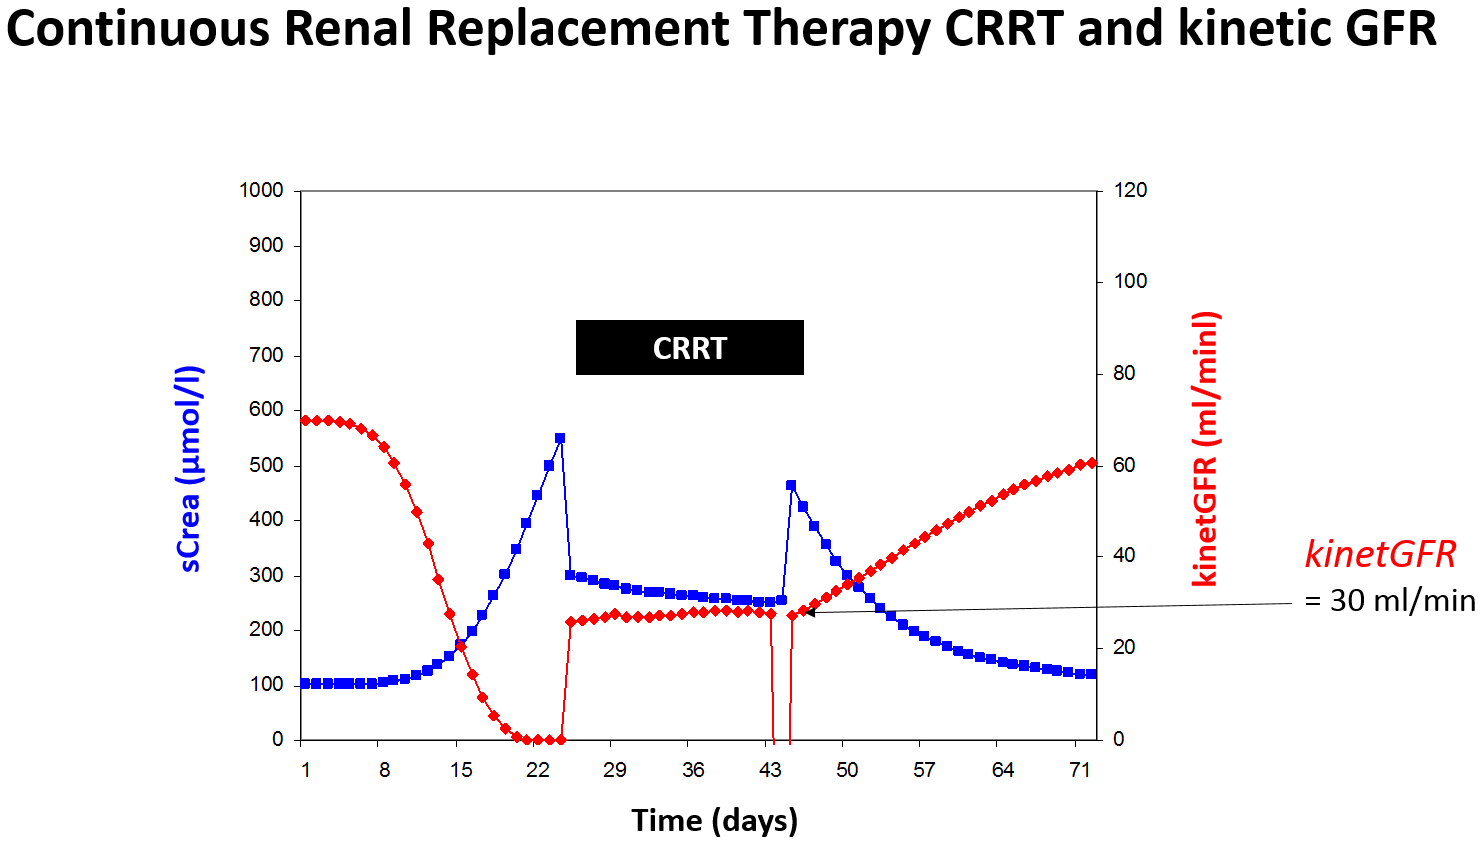
Figure 5: Rapidly changing kidney function can be quantitated by the kinetic GFR even during continuous
renal replacement therapy (CCRT).
The colistin half-life rises from normal 3 hours to 24 hours in renal failure. When on continuous renal replacement therapy the kinetGFR of 35 ml/min might be estimated and the half-life of 7 hours can be predicted. Thus, the normal dose of 320 mg every 8 hours should be adjusted to 320 mg every 12 hours.
There are however some drugs that are eliminated be glomerular filtration but afterwards mainly reabsorbed by tubular uptake. One example is fluconazole where the half-life dramatically increases in renal failure from 25 to 110 hours. When the kinetGFR is 30 ml/min during CRRT, conversely, the filtration is nearly complete but no tubular reabsorption occurs. Thus, the half-life during CRRT is 30 hours or close to 25 hours and a normal dose is needed.
More complex are the kinetics when intermittent hemodialysis is performed (HD). The pharmacokinetic impact of hemodialysis can be quantitated by the fraction eliminated during one dialysis (FR). If hemodialysis is performed only for a short time period or less than 4 hours, a rebound of drug levels frequently is observed after dialysis. This rebound is due to a redistribution phenomenon of the drug from the tissue into the plasma. This rebound can lead to an overestimation of the effect of hemodialysis on drug elimination. If hemodialysis is performed for a time longer than 3 times the re-distribution alpha half-live, however, the redistribution from tissue is less than 10% and negligible.
Generally, the fraction removed by hemodialysis can be estimated from the elimination or beta half-life during dialysis (T1/2 HD).
The effect of hemodialysis on drug kinetics must be replaced by the substitution dose or supplementary dose (Dsuppl). A common practice is to administer the dose after dialysis just to safekeeping the drug from wasting and just to guarantee sufficient drug levels during the interval between dialysis. Accordingly, the dose after hemodialysis (DHD) is both, the dose adjusted to kidney failure and the supplementary dose (Figure 6).
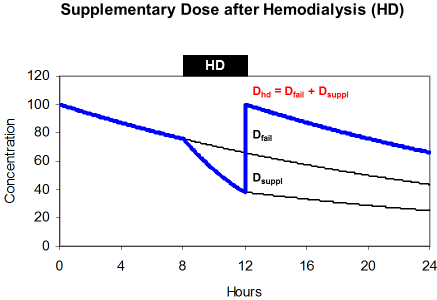
maintenance dose (Dfail) and supplements the eliminated fraction
(Dsuppl).
The supplementary dose replaces the amount of the drug that is eliminated during dialysis. This amount is a function of the removed fraction (FR), of the loading dose (Dstart) and of the dose adjusted to renal failure (Dfail). When hemodialysis is performed at the end of the administration interval the amount in the body is the difference between the loading dose (Dstart) and the maintenance dose (Dfail).
By transformation it can be shown that the dose after dialysis is often just the loading dose.
The normal acyclovir half-life is 2.5 hours but 25 hours in renal failure. During 4 hour hemodialysis the removed fraction is 50% since the half-life on dialysis is 4 hours. The dose adjusted to renal failure is 360 mg every 24 hours but the dose after dialysis should be 560 mg. Since 25% of the loading dose will persist in the body, the dose after dialysis is 75% of the normal 750 mg dose. This solution can often be simplified and the dose after dialysis is the loading dose the longer (tHD>4 h) and more efficiently the dialysis is performed.
This advice applies for the recommendation to administer antibiotics after dialysis just to have antibiotic drug concentrations above the threshold for the complete time interval between the dialysis sessions. However, for aminoglycosides the recommendation has repetitively been made that for example gentamicin should be given immediately before dialysis to produce high peak concentrations [18]. This practice, however, works only if a gentamicin bolus dose is administered before dialysis that must be 4-times higher (320 mg) than the adjusted once-daily maintenance dose (80 mg). The fraction eliminated on dialysis is 75% for gentamicin (FR=0.75).
According to such a high pre-dialysis dose, the amount in the body after dialysis is still 80 mg producing gentamicin concentrations sufficiently high for the time period after dialysis until the next dose is given.
4 Further research: target concentration
A high Hill coefficient means that the threshold concentration is high and close to the concentration producing the half-maximum effect. At the same time – and this is not common knowledge – the ceiling concentration will be relatively low and only slightly higher than the CE50 when the Hill coefficient is high (Figure 4). The CE50 is independent from the Hill coefficient and can be estimated as either the geometric mean or the logarithmic mean of the threshold and of the ceiling concentrations.
Time-dependent effect: Antibiotics with time-dependent action have a high Hill coefficient and a high threshold concentration. But simultaneously, the ceiling concentration is low. The consequence for drug dose adjustment is that the trough concentration must be high to stay above the threshold but the peak concentration is not critical since the ceiling is relatively low and easily obtained (Table 2). The vancomycin target is an AUC24 of 400 above the MIC. Consequently, the recommended trough concentration has been consistently elevated from 10 to 15 mg/l for vancomycin in the last 20 years.
| Concentration-dependent | Time-dependent | |
| Hill coefficient | H<2.0 | H>2.0 |
| Threshold concentration = CE05 | CE05<<CE50 | CE05<CE50 |
| Ceiling concentration = CE95 | CE95>>CE50 | CE95>CE50 |
| Target concentration range | CE95/CE05>19 | CE95/CE05<19 |
| Dose adjustment |
D=const. |
Tau=const. D→reduction |
| Target for dose adjustment | Cpeak ↑ | Ctrough ↑ |
| Examples |
Aminoglycosides (Gentamicin) |
Penicillins Cefalosporins Meropenem Clarithromycin Vancomycin |
Concentration-dependent effect: On the other side, there are antibiotics with concentration-dependent action which have a low threshold but a high ceiling concentration. Consequently, the peak concentration should be high for such antibiotics with concentration-dependent action since the ceiling concentration is much higher than the CE50. But the trough concentration is not so critical since the threshold is low (Figure 7).
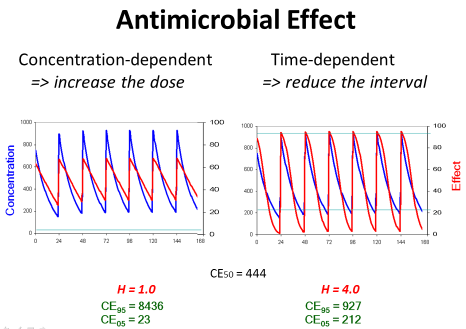
Figure 7: If the antimicrobial effect is concentration-dependent, the dose
should be increased to obtain the maximum effect. If the antimicrobial effect
is time-dependent, conversely, the dose should be given more frequently to
maintain an efficient action at the end of the administration interval.
This contrasts to the view that the time over MIC is the target (%T>MIC). With continuous infusion of piperacillin 8,000 mg per day the average steady state concentration is 25 mg/l and easily above the MIC of even 16 mg/l and achieves a 100%T>MIC for the complete treatment time [19]. But this regimen might be insufficient in patients with normal or even augmented renal clearance [20]. Therefore, one could think the other way that the average steady state concentration with continuous infusion should be 4xMIC. This targets the concentration CE50 producing the half-maximum effect (Caverage~CE50). Since impaired kidney function leads to longer half-life values, the drug kinetics are more similar to continuous infusion than to immediate bolus dosing. Consequently, the target is 4xMIC and not %T>MIC in kidney failure. Otherwise with intermittent dosing the target is a trough concentration above the MIC (Ctrough>MIC).
5 Conclusion
A therapeutic drug level monitoring (TDM) is also increasingly recommended (Table 3). This applies to aminoglycosides, to piperacillin, to meropenem, to vancomycin and to linezolid. However, the target concentrations are different in patients with kidney failure as compared to normal conditions. The peak could be the same and constant but the trough concentrations must be higher. If a TDM is established, one must be ready not only to reduce the dose when levels are too high; but also one must be ready to increase the dose if targets are defined but not yet met [11]. Based on the above principles, explicit dose adjustment recommendations can be made (Table 1).
| Target concentration | |||||
| Ctrough | Caverage | Cpeak | |||
| Continuous infusion | |||||
| GFR normal | GFR<15 ml/min | Dose adjusted to GFR | GFR normal | GFR<15 ml/min | |
| Amikacin | <10 mg/l | 15 mg/l | 50 mg/l | 50 mg/l | |
| Cefazolin | 20 mg/l | 50 mg/l | 200 mg/l | 150 mg/l | |
| Gentamicin | <2 mg/l | 3–5 mg/l | 10 mg/l | 10 mg/l | |
| Linezolid | 4–8 mg/l | 4–8 mg/l | 20–30 mg/l | 20–30 mg/l | |
| Meropenem | <4 mg/l | 10 mg/l |
Target=4xMIC |
40 mg/l | 30 mg/l |
| Piperacillin | 15 mg/l | 60 mg/l | Caverage=25 mg/l | 250 mg/l | 250 mg/l |
| Vancomycin | 10 mg/l | 15 mg/l |
Target 24-h AUC/MIC=400 h mg/l |
40 mg/l | 30 mg/l |
Acknowledgement
The support by Julia Langgartner, Intensive Care Medicine, Regensburg University was very helpful.
Conflict of interest
Consultant: MSD Sharp & Dohme
References
[1] Fugate JE, Kalimullah EA, Hocker SE, Clark SL, Wijdicks EF, Rabinstein AA. Cefepime neurotoxicity in the intensive care unit: a cause of severe, underappreciated encephalopathy. Crit Care. 2013 Nov;17(6):R264. DOI: 10.1186/cc13094[2] Eckhardt A, Borner K, Keller F, Zellner D. Dosage adjustment of antiinfective therapy in patients with renal impairment. Int J Clin Pharmacol Ther. 1997 Mar;35(3):99-102.
[3] Czock D, Spitaletta M, Keller F. Suboptimal antimicrobial drug exposure in patients with renal impairment. Int J Clin Pharm. 2015 Oct;37(5):906-16. DOI: 10.1007/s11096-015-0141-0
[4] Keller F, Schröppel B, Ludwig U. Pharmacokinetic and pharmacodynamic considerations of antimicrobial drug therapy in cancer patients with kidney dysfunction. World J Nephrol. 2015 Jul;4(3):330-44. DOI: 10.5527/wjn.v4.i3.330
[5] Tsinalis D, Thiel GT. An easy to calculate equation to estimate GFR based on inulin clearance. Nephrol Dial Transplant. 2009 Oct;24(10):3055-61. DOI: 10.1093/ndt/gfp193
[6] Chen S. Retooling the creatinine clearance equation to estimate kinetic GFR when the plasma creatinine is changing acutely. J Am Soc Nephrol. 2013 May;24(6):877-88. DOI: 10.1681/ASN.2012070653
[7] Dettli LC. Drug dosage in patients with renal disease. Clin Pharmacol Ther. 1974 Jul;16(1):274-80.
[8] Mischnik A, Kaase M, Lübbert C, Seifert H, Kern WV. Carbapenem-Resistenz bei Enterobakterien, Pseudomonas aeruginosa und Acinetobacter baumannii [Carbapenem-resistance in Enterobacteriaceae, Pseudomonas aeruginosa and Acinetobacter baumannii]. Dtsch Med Wochenschr. 2015 Feb;140(3):172-6. DOI: 10.1055/s-0041-100105
[9] Ferrer R, Martin-Loeches I, Phillips G, Osborn TM, Townsend S, Dellinger RP, Artigas A, Schorr C, Levy MM. Empiric antibiotic treatment reduces mortality in severe sepsis and septic shock from the first hour: results from a guideline-based performance improvement program. Crit Care Med. 2014 Aug;42(8):1749-55. DOI: 10.1097/CCM.0000000000000330
[10] Bremmer DN, Nicolau DP, Burcham P, Chunduri A, Shidham G, Bauer KA. Ceftolozane/Tazobactam Pharmacokinetics in a Critically Ill Adult Receiving Continuous Renal Replacement Therapy. Pharmacotherapy. 2016 May;36(5):e30-e33. DOI: 10.1002/phar.1744
[11] De Waele JJ, Carrette S, Carlier M, Stove V, Boelens J, Claeys G, Leroux-Roels I, Hoste E, Depuydt P, Decruyenaere J, Verstraete AG. Therapeutic drug monitoring-based dose optimisation of piperacillin and meropenem: a randomised controlled trial. Intensive Care Med. 2014 Mar;40(3):380-7. DOI: 10.1007/s00134-013-3187-2
[12] Kunin CM. A guide to use of antibiotics in patients with renal disease. A table of recommended doses and factors governing serum levels. Ann Intern Med. 1967 Jul;67(1):151-8. DOI: 10.7326/0003-4819-67-1-151
[13] Langgartner J, Vasold A, Glück T, Reng M, Kees F. Pharmacokinetics of meropenem during intermittent and continuous intravenous application in patients treated by continuous renal replacement therapy. Intensive Care Med. 2008 Jun;34(6):1091-6. DOI: 10.1007/s00134-008-1034-7
[14] Roberts JA, Abdul-Aziz MH, Davis JS, Dulhunty JM, Cotta MO, Myburgh J, Bellomo R, Lipman J. Continuous versus Intermittent β-Lactam Infusion in Severe Sepsis. A Meta-analysis of Individual Patient Data from Randomized Trials. Am J Respir Crit Care Med. 2016 Sep;194(6):681-91. DOI: 10.1164/rccm.201601-0024OC
[15] Czock D, Keller F. Mechanism-based pharmacokinetic-pharmacodynamic modeling of antimicrobial drug effects. J Pharmacokinet Pharmacodyn. 2007 Dec;34(6):727-51. DOI: 10.1007/s10928-007-9069-x
[16] Horgen L, Legrand E, Rastogi N. Postantibiotic effect of amikacin, rifampin, sparfloxacin, clofazimine and clarithromycin against Mycobacterium avium. Res Microbiol. 1997 Nov;148(8):673-81. DOI: 10.1016/S0923-2508(99)80066-7
[17] Martinez MN, Papich MG, Drusano GL. Dosing regimen matters: the importance of early intervention and rapid attainment of the pharmacokinetic/pharmacodynamic target. Antimicrob Agents Chemother. 2012 Jun;56(6):2795-805. DOI: 10.1128/AAC.05360-11
[18] Veinstein A, Venisse N, Badin J, Pinsard M, Robert R, Dupuis A. Gentamicin in hemodialyzed critical care patients: early dialysis after administration of a high dose should be considered. Antimicrob Agents Chemother. 2013 Feb;57(2):977-82. DOI: 10.1128/AAC.01762-12
[19] Langgartner J, Lehn N, Glück T, Herzig H, Kees F. Comparison of the pharmacokinetics of piperacillin and sulbactam during intermittent and continuous intravenous infusion. Chemotherapy. 2007;53(5):370-7. DOI: 10.1159/000107725
[20] Zander J, Döbbeler G, Nagel D, Maier B, Scharf C, Huseyn-Zada M, Jung J, Frey L, Vogeser M, Zoller M. Piperacillin concentration in relation to therapeutic range in critically ill patients – a prospective observational study. Crit Care. 2016 Apr;20:79. DOI: 10.1186/s13054-016-1255-z