
Optimizing digital ear canal scanning protocols for hearing aid acoustics: Balancing efficiency and accuracy in clinical practice
Steffen Kreikemeier 1Henrik Holger Mallwitz 1
1 Center of Excellence in Audiology, Aalen University of Applied Sciences, Aalen, Germany
Abstract
The digitization of ear canal impression processes has transformed hearing aid acoustics, with over 90% of laboratories now employing digital manufacturing for earmolds. However, the optimal balance between scan efficiency and accuracy remains underexplored in clinical practice. In the present study the reproducibility of ear canal scans across three protocols varying in duration of the scans short (30–60 s), medium (70–120 s), and comprehensive (140–210 s) was investigated. Shorter scan times resulted intentionally in missing data in the digital surface. Using an idealized Standard Triangle Language (STL) model as a reference geometry, intra-individual repetitive measurement series with consecutive scans per protocol were conducted by different investigators. Statistical analysis included descriptive metrics, normality testing, and non-parametric group comparisons. The results indicate high consistency across all protocols, with mean deviations below 0.2 mm, which is well within the tolerances of additive manufacturing. The short protocol exhibited the largest variability (mean –0.11 mm, SD: 0.05 mm), while medium (mean –0.05 mm, SD: 0.02 mm) and comprehensive (mean –0.04 mm, SD: 0.02 mm) protocols showed negligible differences. These findings demonstrate that scan durations as brief as 30–60 s preserve practical accuracy, enabling efficient clinical workflows without compromising precision. The study provides empirical evidence for optimizing digital scanning protocols in hearing aid fitting, addressing a critical gap in audiologic practice.
Keywords
ear canal scanner, ear impression, additive manufacturing, geometric comparison, earmolds
1 Introduction
Manual ear canal impressions with silicone are the standard procedure in Germany. It takes 10–15 min to perform the impressions for both ears. This time could be used for optimizing the hearing aid fitting [1]. The silicone impression is then digitalized, which takes an additional step in the process. The digitization of ear canal impression processes has revolutionized hearing aid acoustics, with over 90% of laboratories now relying on digital manufacturing for earmolds. This shift has enabled precise 3D capture of ear canal anatomy, forming the basis for additive manufacturing of customized hearing aid components [2]. However, the clinical adoption of digital scanning protocols remains inconsistent, particularly regarding the trade-off between scan duration and accuracy. While longer scans theoretically yield a higher amount of data for the digital model, their practical utility in routine clinical settings is limited by time constraints and patient comfort [3].
The acoustic properties of the ear canal play a critical role in hearing aid performance, as even minor deviations in geometry can significantly alter sound transmission or comfort [4]. Previous studies have highlighted the importance of accurate ear molds for optimizing hearing aid fitting and venting [5], [6], [7]. Nevertheless, the reproducibility of digital scanning protocols under varying durations has not been systematically evaluated, leaving a gap in evidence-based guidelines for clinical practice. This study investigates the variability of digital scanning protocols to identify parameters that balance efficiency with clinical accuracy. It is hypothesized that shorter scan durations (30–60 s) can achieve sufficient precision for hearing aid manufacturing without compromising practical utility. The objective is to determine whether reducing scan time significantly impacts the reproducibility of ear canal models, thereby optimizing workflows for hearing care professionals and if too intensive scanning increases errors. By empirically validating the feasibility of shorter scan protocols, this study contributes to the broader goal of improving patient outcomes through optimized technological integration and sustainability [8].
2 Materials and methods
The study employed a systematic approach to evaluate the reproducibility of ear canal scans across three distinct protocols. Technical details of the experimental design and statistical analysis are presented below, organized into focused subsections.
2.1 Hard- and software
An artificial ear canal was designed using the software Siemens NX version 1980 and printed on an Asiga with the Composer 2.0.4 using the resin pro3dure printodent GR-13. Scans of the artificial ear canal were performed with the Natus Otoscan version 1.7.12883.0. The primary metric was the mean deviation (in mm) from the reference geometry, calculated across the entire ear canal surface with the software Geomagic Design X version 2024.2.0. The standardized test body consisted of a digitalized outer ear of a real human and an, in the Computer Aided Design (CAD) software Siemens NX designed, straight ear canal with sharp edges. For the statistics, JMP version 19 was used.
2.2 Experimental design and scanning protocols
A standardized test body was developed based on an idealized STL model of a typical human ear canal, serving as the reference geometry for all measurements. A straight ear canal was chosen to get scan results even from investigators who do not have any experience with the scanner. Straight ear canals are in general easier to scan with the used ear canal scanner. The sharp edges were implemented to analyze in future studies if the scanner can pick up the details of these edges. Intra-individual repetitive measurement series with consecutive scans per protocol were conducted by seven different investigators. Three scanning protocols were implemented with varying durations and resulting quantities of missing data:
b) Medium Protocol: 70–120 s per ear, yielding minimal missing data (black contour)
c) Comprehensive Protocol: 140–210 s per ear, generating complete scans without missing data (see Figure 1 [Fig. 1])
Figure 1: Scan results of an ear canal. a) Short protocol (yellow contour), b) medium protocol (black contour), c) comprehensive protocol without missing data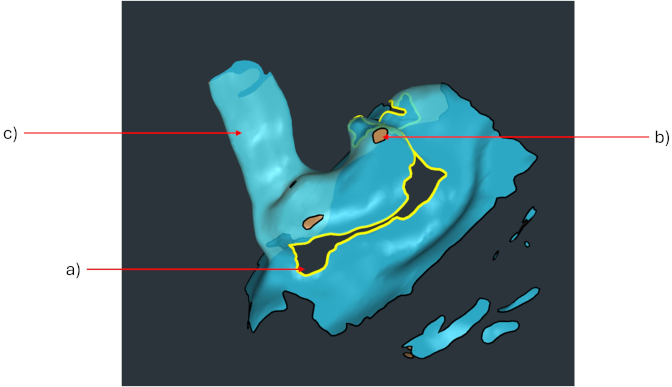
2.3 Statistical analysis
To examine the distribution properties of the dependent variable, a Shapiro–Wilk test for normality was conducted. A Levene test was used to verify the assumption of homogeneity of variances, if the assumptions for a classical one-way ANOVA are fulfilled. A Kruskal–Wallis test was conducted to identify any global differences in all three groups. To further examine the differences between the groups, a nonparametric Mann–Whitney U test was used for pairwise comparisons of the group types (yellow contour, black contour, no missing data). To control for the increased probability of error resulting from the multiple pairwise comparisons, the resulting p-values were adjusted using the Bonferroni correction.
3 Results
The dataset comprised continuous measurements of geometric deviation for each protocol group. Yellow contour (n=25), black contour (n=33) and no missing data (n=30). The number of scans performed by the participating investigators that met the specified criteria varies. If the scans did not meet the criteria for yellow contours regarding missing data, because no data were actually missing, the data had to be excluded. This resulted in varying numbers of data sets for each protocol group. Descriptive statistics including means and standard deviations (SD) are shown in Table 1 [Tab. 1].
Table 1: Descriptive statistics of geometric deviations across scanning protocols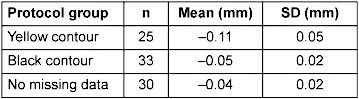
The averaged maximum deviations from the reference geometry remained below 0.2 mm. Greater deviations could only be observed in areas not relevant for earmolds. When comparing protocol performance, minimal differences emerged in the resulting geometries. An example of the comparison of digital impression with the software Geomagic Design X is shown in Figure 2 [Fig. 2]. The short protocol (30–60 s) exhibited the largest variability, as anticipated. However, even these scans achieved clinically acceptable precision, with mean deviations of –0.11 mm (SD: 0.05 mm). The medium protocol (70–120 s) showed improved consistency, reducing deviations to <0.06 mm when scans contained only minor missing data. The comprehensive protocol (140–210 s) demonstrated the highest precision, though the marginal improvement over the medium protocol did not appear clinically significant.
Figure 2: Comparison of two digital impressions with Geomagic Design X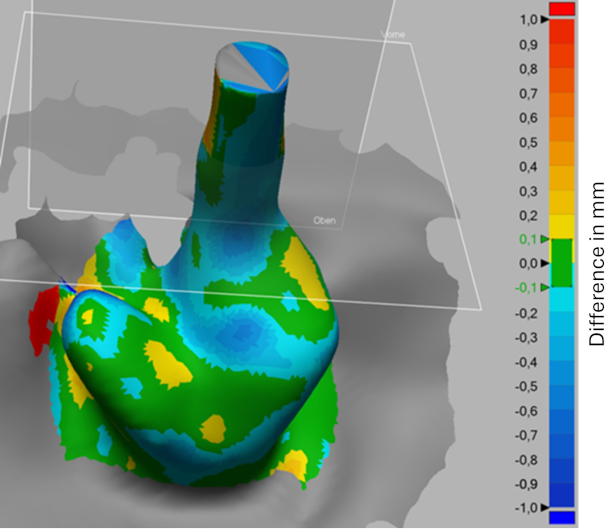
Assumption testing revealed that while two groups (yellow and black contours) showed no significant deviations from normality (Shapiro-Wilk p=0.105 for yellow contours and p=0.771 for black contours respectively), the no missing data group violated this assumption (p<0.001). The Levene test confirmed significant variance heterogeneity (p<0.001), necessitating non-parametric approaches. Therefore, the conditions for a classical one-way ANOVA are not fully met. The primary analysis employed a Kruskal-Wallis test with post-hoc Mann-Whitney U tests (Bonferroni-corrected with αkorr=0.0167).
Yellow contours vs. black contours
The comparison between data of the yellow contours and black contours showed highly significant differences (pkorr<0.001), with the data of the yellow contours exhibiting substantially larger deviations.
Yellow contours vs. no missing data
The contrast between data of the yellow contours and the group with no missing data also demonstrated significant differences (pkorr<0.001).
Black contours vs. no missing data
The most clinically relevant comparison between the data of black contours and the group with no missing data showed no significant difference after Bonferroni correction (pkorr=0.086).
4 Discussion
These findings suggest that scan duration primarily affects measurement variability rather than absolute accuracy of the scanner. The scanner is accurate every time, but the software needs to interpolate the missing data which results in different geometries of the final STL file. The transition from short to medium protocols yielded the most substantial improvement in consistency, while the additional time investment in comprehensive scans provided diminishing returns. This pattern aligns with theoretical expectations about the amount of scan data and the surface reconstruction accuracy [9]. The geometric deviations observed in this study fall below the threshold known to affect hearing aid acoustics, as previous research indicates that variations <0.3 mm have negligible impact on sound transmission characteristics and is within the accepted manufacturing tolerances for the additive fabrication processes [10], [11], [12].
The experimental design controlled for potential confounding factors by using a standardized test body and consistent scanning conditions. This methodological framework ensures that the findings are both statistically rigorous and clinically interpretable, providing actionable insights for hearing care professionals implementing digital scanning workflows.
Prior to conducting comparative analyses, the dataset underwent rigorous assumption testing to ensure the validity of statistical inferences. The Shapiro-Wilk test evaluated normality across protocol groups, revealing distinct distribution patterns. While the short protocol (yellow contours, p=0.105) and medium protocol (black contours, p=0.771) showed no significant deviations from normality, the comprehensive protocol (no missing data) exhibited clear non-normality (p<0.001). This pattern suggests that extended scan durations may produce measurement distributions that violate parametric assumptions. The Levene test for variance homogeneity yielded significant results (p<0.001). Indicating substantial differences in variability across protocol groups. This heteroscedasticity was visually apparent in the spread of deviation measurements, with the short protocol showing approximately 3.3 times greater variability than the comprehensive protocol. Such variance inequality, combined with the non-normality in the comprehensive group (no missing data), necessitated nonparametric analytical approaches to maintain statistical rigor [13].
The findings of this study carry significant implications for both clinical practice and future research in hearing aid acoustics. The demonstration that scan duration as brief as 30–60 s can maintain clinically acceptable accuracy challenges conventional assumptions about digital ear canal scanning. For practitioners, this suggests that workflow efficiency can be substantially improved without compromising the precision required for hearing aid manufacturing. The medium protocol (70–120 s) emerges as particularly promising, offering near-equivalent accuracy to comprehensive scans while reducing the time the patient must spend at the hearing care professional by approximately 40%. This balance between speed and precision could enhance patient throughput while maintaining the quality standards demanded by additive manufacturing processes. Several methodological considerations warrant discussion. Mølhave et al. complained about problems with the scan software as well as scanning failures because of hairs and wax [14]. Therefore, an artificial ear and ear canal was used and did not show any of the reported difficulties. The use of an idealized STL model as a reference geometry, while providing standardized measurement conditions, may not fully capture the anatomical variability encountered in clinical practice. The study’s focus on geometric deviations also does not account for potential interactions between scan quality and hearing aid acoustic performance, which could be influenced by factors such as vent placement or receiver positioning [15]. Furthermore, the repetitive measurement design, while controlling for intra-operator variability, does not reflect the full spectrum of clinical challenges including patient movement, cerumen presence, or difficult canal anatomies. These limitations suggest that while the core findings are robust under controlled conditions, real-world implementation may require additional validation studies.
5 Conclusion
This study demonstrates that digital ear canal scanning protocols can be significantly optimized without compromising the accuracy required for hearing aid manufacturing. The findings confirm that scan durations as brief as 30–60 s yield geometric deviations well within clinical tolerances, while medium-duration protocols (70–120 s) achieve near-equivalent precision to comprehensive scans. The robust statistical analyses reveal a relationship between scan duration and measurement accuracy, suggesting the existence of practical thresholds beyond which extended scanning provides diminishing returns. These insights directly address a critical gap in audiologic practice by providing empirical evidence for protocol optimization. Future research should investigate adaptive scanning algorithms and real-world validation across diverse anatomical variations to further refine these protocols. The study’s outcomes enable more efficient clinical workflows while maintaining the high precision standards essential for personalized hearing solutions.
Notes
Conference presentation
This contribution was presented at the 28th Annual Conference of the German Society of Audiology and published as an abstract [16].
Use of AI
To ensure linguistic precision and clarity, AI-assisted tools were utilized during the preparation of this manuscript. Specifically, DeepL (https://www.deepl.com, version 26.5.1, used between April and June 2026) was employed to assist with the translation of technical terms. Subsequently, Writefull (https://my.writefull.com, version 2025.59.0(#1326), used between April and June 2026) was used for academic copyediting, enhancing the sentence structure, and ensuring compliance with standard scientific English.
Funding
This work was supported by the KMU-innovativ program, funded by the German Federal Ministry of Research, Technology and Space (BMFTR), funding code 13XP5223B.
Competing interests
The authors declare that they have no competing interests.
References
[1] Chua KW, Yeo HKH, Tan CKL, Martinez JC, Goh ZH, Dritsas S, Simpson RE. A Novel Ear Impression-Taking Method Using Structured Light Imaging and Machine Learning: A Pilot Proof of Concept Study with Patients' Feedback on Prototype. J Clin Med. 2024 Feb;13(5):1214. DOI: 10.3390/jcm13051214[2] Oliveira JRM de, Amantini RCB, Dora DR, Yachioka PL. Apresentação do processo de confecção da cápsula do aparelho de amplificação sonora individual intra-aural por meio de digitalização. Rev. CEFAC 2013; 15(1):89-93. DOI: 10.1590/S1516-18462012005000031
[3] Barnes J, Sabo RT, Coelho DH. A novel method to measure the external auditory canal: Normative data and practical implications. Am J Otolaryngol. 2018;39(2):146-9. DOI: 10.1016/j.amjoto.2017.12.006
[4] Denk F, Hieke T, Roberz M, Husstedt H. Occlusion and coupling effects with different earmold designs - all a matter of opening the ear canal? Int J Audiol. 2023 Mar;62(3):227-37. DOI: 10.1080/14992027.2022.2039966
[5] Denk F, Ohlmann K, Kollmeier B. Detection mechanisms for processing delays in simulated vented hearing devices. JASA Express Lett. 2021 Jan;1(1):014402. DOI: 10.1121/10.0003064
[6] Kuk F, Keenan D, Lau CC. Comparison of vent effects between a solid earmold and a hollow earmold. J Am Acad Audiol. 2009 Sep;20(8):480-91. DOI: 10.3766/jaaa.20.8.3
[7] Gatehouse S. Limitations on insertion gains with vented earmoulds imposed by oscillatory feedback. Br J Audiol. 1989 May;23(2):133-6. DOI: 10.3109/03005368909077831
[8] Ghobakhloo M, Mahdiraji HA, Iranmanesh M, Jafari-Sadeghi V. From Industry 4.0 Digital Manufacturing to Industry 5.0 Digital Society: a Roadmap Toward Human-Centric, Sustainable, and Resilient Production. Inf Syst Front. 2024. DOI: 10.1007/s10796-024-10476-z
[9] Li SF, Zhang TY, Wang ZM. An approach for precise three-dimensional modeling of the human inner ear. ORL J Otorhinolaryngol Relat Spec. 2006;68(5):302-10. DOI: 10.1159/000094378
[10] Voogdt U. Otoplastik: Die individuelle Otoplastik zur Hörgeräteversorgung und als persönlicher Gehörschutz im Lärm. 4th revised ed. Heidelberg: Median-Verlag von Killisch-Horn; 2013. (Akademie für Hörgeräte-Akustik; 2).
[11] Berger U, Hartmann A, Schmid D. 3D-Druck - Additive Fertigungsverfahren: Rapid Prototyping - Rapid Tooling - Rapid Manufacturing. 4th ed. Haan-Gruiten: Verlag Europa-Lehrmittel - Nourney Vollmer GmbH & Co. KG; 2023. (Europa Lehrmittel).
[12] Suárez L, Del Mar Espinosa M. Assessment on the use of additive manufacturing technologies for acoustic applications. Int J Adv Manuf Technol. 2020; 109(9-12):2691-705. DOI: 10.1007/s00170-020-05853-2
[13] Desu MM, Raghavarao D. Nonparametric statistical methods for complete and censored data. Boca Raton, Florida, London, New York: CRC Press; 2004. DOI: 10.1201/9781482285895
[14] Mølhave M, Madsen M, Degnbol LM, Christensen ALB, Ovesen T. Three-dimensional scan versus conventional mould of outer ear in fabricating earmolds for hearing aids: a randomized controlled trial. Int J Audiol. 2026 Feb:1-8. DOI: 10.1080/14992027.2026.2630118
[15] Tognola G, Parazzini M, Svelto C, Galli M, Ravazzani P, Grandori F. Design of hearing aid shells by three dimensional laser scanning and mesh reconstruction. J Biomed Opt. 2004;9(4):835-43. DOI: 10.1117/1.1756595
[16] Kreikemeier S, Mallwitz HH. Reproduzierbarkeit des Gehörgangscans bei unterschiedlich großer Detailaufnahme. In: Deutsche Gesellschaft für Audiologie e. V., editor. 28. Jahrestagung der Deutschen Gesellschaft für Audiologie. Oldenburg, 04.-06.03.2026. Düsseldorf: German Medical Science GMS Publishing House; 2026. Doc232. DOI: 10.3205/26dga232