Greenfeed system
Yvanne Rochette 2
David Humphries 3
Gilles Renand 4
1 Université Clermont Auvergne, INRAE, Saint-Genès-Champanelle, Frankreich
2 Université Clermont Auvergne, INRAE, Saint-Genès-Champanelle, France
3 University of Reading, Reading, Vereinigtes Königreich
4 GABI, INRAE, Jouy en Josas, Frankreich
Keywords
air flow, span gas, background concentration, calibrationIntroduction
The GreenFeed (GF) system spot samples the breath of individual animals for short periods (3–7 min), at various times of the day, over several days, weeks, or months to measure methane production. To obtain a diurnal CH4 emission pattern from the GF system, the animal visits need to be appropriately distributed over a 24 h feeding cycle [1]. This can be difficult to achieve as the number of visits is greater during certain hours of the day. However, visits can be manipulated to some extent by the type of ration provided [2], [3]. Arthur [4] performed a field study using beef cattle, and concluded that 30 observations per animal (15 d, cattle fed an ad libitum roughage diet) were sufficient to produce a reliable CH4 emission outcome from the GF system, if the durations of each visit are sufficient (minimum of 3 min). Others have stated that 50 spot measurements per animal were needed over a 17 d period to obtain a high repeatability (R=0.7) for dairy cows [5]. Manafiazar [6] concluded that a minimum of 20 spot samples over a 7- to 14-d period would be highly repeatable as well as highly correlated with feed intake. Ultimately, accurate outcomes from the GF system can be obtained when the operator strictly controls the number and timing of animal visits. This can be easily managed in tie-stalls [7], [8] but is more difficult in grazing systems [9].
Prerequisites
The purpose of the present guideline is to provide key steps on measuring gas exchange from ruminants by the use of GreenFeed (GF) system, manufactured by C-Lock inc. (South Dakota, USA; https://c-lockinc.com/). Unlike respiration chambers, the GF system is not recommended for use with rumen cannulated animals due to the potential loss of gas via the cannula, and the effects of fistulation and leakage on eructation peak profiles.
As shown in Figure 1, when an animal visits the unit, it is identified by an RFID reader and it receives a small amount of pelleted concentrate. While expecting and swallowing the dropping pellets, all the gas expired by the animal is extracted into the system. Simultaneously, gas concentration, airflow rate and head position of the animal are measured by the system; data are stored and transmitted to a server where they are processed, allowing the user to easily access a summarized report of calculated fluxes. The Animal Trait Ontology (ATOL) and Environment Ontology (EOL) for Livestock numbers linked with this guideline are: ATOL_0001390, ATOL_0000815, ATOL_0001391, ATOL_0001392, EOL_0001780, EOL_0000178 and EOL_0000040 (for complete list of ATOL, please visit https://www.atol-ontology.com/en/erter-2/).
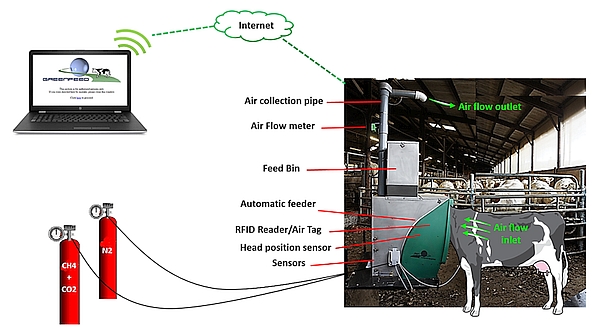
Gas emissions (CH4 and CO2 in g/d) are calculated from the gas concentration of the gas expired (corrected by gas concentration in the ambient air when no animal is using the GF), the air flow rate in the collection pipe, rate of air capture of the system and air temperature. This calculation is done at each visit if the animal’s head is correctly positioned during 3 min at least (detected by the head proximity sensor).
\(\small CH_{\textit 4\_volume} = CR \times \Sigma_t [\Delta t \times (CH_{\textit4\_average} - {CH}_{\textit4\_background}) \times Q_{air}] \times F_c\)
where is CR = capture rate adjustment, determined using the tracer (%); Δt = time period over which emissions are measured (1 s); CH4_average = average concentrations during the measurement period (%); CH4_background = background concentrations of CH4 (%); Qair = airflow rate during the measurement period (flow per unit time), and Fc = dimensional factor.
The following procedure comes from the experience gained by users of GF equipped with an automatic daily calibration option for CH4 and CO2 emission measurements from cattle housed in livestock buildings. It summarizes all the necessary elements and operations to be performed for the successful start-up, use and shut down of the device.
A – Selection of the most appropriate place to install the GF in the building and choice of concentrate
- The GF is compact (220 cm length × 260 cm height × 90 cm width).
- It is useful to keep the GF on its original wheeled trolley in order to move it away from the animals during calibration and maintenance operations. Environments with high levels of dust should be avoided to reduce the build-up of dirt on the system. A dust filtration system is fitted to protect internal components (gas concentration analysers and flow meters, etc.). It is good practice to turn the fan OFF when bedding the lying area with dusty material such as chopped straw.
- If animals, in a single yard, have access to several GF units, it is recommended to not put them side by side, unless each unit has an effective race to prevent animals switching from one unit to the other as this will compromise the quality of visits (low duration).
- The GF must be installed to allow easy access for the animals (enter, exit). It is also recommended not to place the GF in a dark place or in front of a light source which could frighten animals.
- If space in the animal housing is limited then the GF units can be located externally by replacing an external gate with a short race with the GF unit at the end. This approach will reduce system contamination from bedding dust, and the background CO2 and CH4 concentrations may be lower and more consistent.
- The diameter of the pellets used as the attractant bait in the feeder must not exceed 7 mm. Use a highly palatable pelleted concentrate that is tightly formulated. Avoid loosely formulated crumbly pellets as these absorb moisture and may foul the pellet delivery system.
B – Internet connection and configuration of the GF
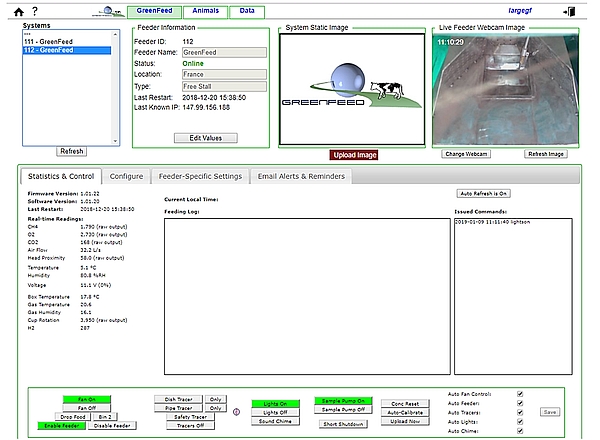
The GF unit is configured on the C-Lock web site (Figure 2) through the internet connection. To be automatically identified on the computer server, some specific key codes to each site have to be registered inside the system (IP address, gateway, mask and DNS1 and DNS2) in agreement with the IT manager of the institute hosting the GF. When this step is achieved with success, the GF appears ON LINE on the website (Figure 2). Alternatively, where no Wi-Fi or hard wired internet connection is available, such as in an isolated location, the GF system can operate independently over the mobile phone network, provided a good signal is available.
C – Calibration of the different measurement components
- All measurement components of the GF must be tested before the start of the experiment by checking their respective response in real-time on the website’s data page.
- The fan is ON when a humming/blowing noise associated to an air flow exits from the top of the system. A correct flow rate is around 27 l/s.
- For the proximity sensor, place your hand over the black rectangle located just above the feed dish.
- The temperature sensors measure the ambient temperature.
- To be identified and registered in the GF, each animal must wear an electronic ear tag type HDX (ISO 11784/11785 according to C-Lock) for RFID reader. If animals are wearing other tags, ensure that they will not interfere with the animals’ RFID ear tag.
- To be sure that the RFID antenna is working well, present an ear tag manually at ~30 cm from the RFID antenna – a feeding chime should sound (if enabled) and feed will be delivered to the feed dish. Then, check on the website that the ear tag has been well registered.
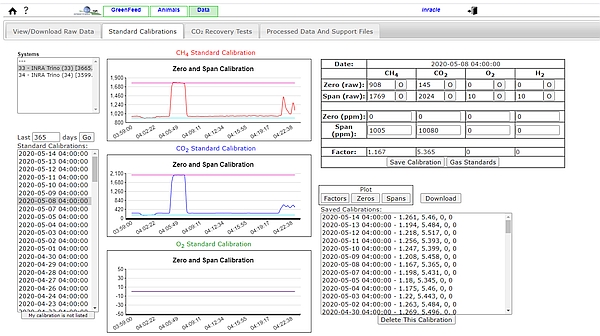
- For the gas concentration sensors, a zero and a span calibration (Figure 3) have to be regularly performed. If the GF unit is fitted with automatic calibration then calibration can be automatically performed once a day, by injecting a calibration gas mixture with certificated concentrations of CH4 (1,000 ppm, or 0.1%) and CO2 (10,000 ppm, or 1%) in nitrogen. A ‘zero-air’ standard (100% nitrogen) is also required to find the sensor ‘baseline’ without CH4 or CO2. If relying on manual calibration this may be performed less frequently but should be conducted at least once weekly.
- Mass scales to perform CO2 recovery test) and to weigh delivery drops of concentrate feed pellets. (2,000 ± 0.1 g).
- All material for cleaning the GF (vacuum cleaner, sponge) or filters (dishwasher is advised but a good manual wash may be suitable).
D – Adaptation period of animals to the GF (1 week)
- The adaptation period may be very short (3–4 d) for some animals but longer for the more reluctant ones. For the latter, it is important to take time to ‘show’ them the GF individually. If the absence of visits persists beyond 1 week, exclude these animals from the experiment.
- The standard training procedure for the animals is to introduce the GF without barriers and with the fan OFF for a few days (1–2 d) in order to allow the more nervous animals to see and smell the concentrate distributed by the GF. Once the animals are familiar with the GF, then the fan is turned ON and barriers on both sides can be positioned to create a short race in order to limit access to one animal at a time to the GF. These access barriers should not be too long to avoid another animal queuing behind in the race and preventing the animal using the GF from retreating (min. = half-length of animal; max. = full-length of animal). The width of the race should be tight enough so that two animals cannot enter together. The best option is to select removable barriers that allow the width of the race to adjust to the animals’ body size; this will change over the course of a study with growing beef cattle. Avoid mixing animals of different sizes in the same yarded group.
E – GF programming via the interface C-Lock online
- Indicate the concentrations of the standard gases used.
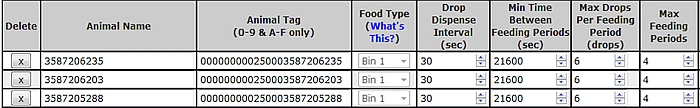
- Correct scheduling of individual animal visits to the GF unit is a key step in obtaining enough spot-measurements to be representative of the daily kinetic of gases emitted by each animal. To achieve this, the system allows the user to specify the number of visits per d, the minimum return time between consecutive visits, the number of drops per visit and the time interval between 2 consecutive drops. The general objective of visit scheduling is through ‘bait’ feeding to keep the head of the animal in the correct position in the hood for at least 3 min per visit and to distribute visits evenly over the 24 h diurnal cycle for the duration of the spot sampling period (Figure 4).
- The example in Figure 4 indicates the maximum intake for an animal visiting the GF unit on 4 occasions over a 24 h period. It should be considered when designing nutritional studies that not all animals will complete 4 visits per d and intakes of ‘bait’ between animals may vary, especially with a maximum allowed feeding periods >4.
- Select «alert messages» to be sent automatically by email to users in real time. The email addresses have to be entered in the system.
F – Monitoring and maintenance of the GF
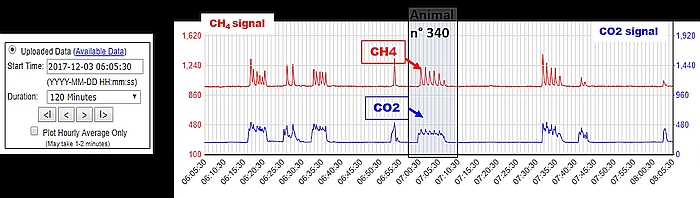
- Daily access to the C-Lock website is recommended for monitoring the general parameters of the GF (air flow, auto-calibration, frequency of feed dispensing, etc.), the animals’ access information (number and duration of visits, etc.), and the CH4 and CO2 sensor signals in response to visits of animals (Figure 5).
- Perform monthly a CO2 recovery test (1 h): a known quantity of CO2 is released into the trough and compared to the quantity of CO2 measured by the GF. The difference between both values must be lower than 5%. This ensures that the volumetric flow rate is accurate and that the IR sensors to measure gas concentration are functional.
- Keep the feed bin filled with pelleted concentrate and check weight (once a week) and the quantity of concentrate distributed by a set of drops to determine the daily quantity of concentrate from the GF ingested by each animal.
- Cleaning of the system: the air filter is changed systematically once or twice a week in dusty conditions or if the flow rate falls below 27 l/s, and is replaced by a new cleaned and dried filter (10-min duration); it is recommended to clean the whole system once a month (1 h): proximity sensor, webcam, feed dish and air holes etc., but avoid introducing excessive water into the GF unit.
G – Post GF experiment
If you do not use the system for a period of time, it is recommended to switch the GF ‘OFF’ (press ‘sleep’ before to ‘stop’ it). Close the gas bottles and empty the feeder of the concentrate. Perform a complete cleaning of the system, block holes (paper) to protect the electric circuits from pests such as rats and mice. Cover the system to protect it from dust and moisture and store it in a secure, dry and well ventilated area.
References
[1] Hristov AN, Kebreab E, Niu M, Oh J, Bannink A, Bayat AR, et al. Symposium review: Uncertainties in enteric methane inventories, measurement techniques, and prediction models. J Dairy Sci. 2018;101(7):6655-74.DOI: 10.3168/jds.2017-13536[2] Hammond KJ, Humphries DJ, Crompton LA, Green C, Reynolds CK. Methane emissions from cattle: Estimates from short-term measurements using a GreenFeed system compared with measurements obtained using respiration chambers or sulphur hexafluoride tracer. Anim Feed Sci Tech. 2015;203:41-52. DOI: 10.1016/j.anifeedsci.2015.02.008
[3] Hammond KJ, Jones AK, Humphries DJ, Crompton LA, Reynolds CK. Effects of diet forage source and neutral detergent fiber content on milk production of dairy cattle and methane emissions determined using GreenFeed and respiration chamber techniques. J Dairy Sci. 2016;99(10):7904-17. DOI: 10.3168/jds.2015-10759
[4] Arthur PF, Barchia IM, Weber C, Bird-Gardiner T, Donoghue KA, Herd RM, et al. Optimizing test procedures for estimating daily methane and carbon dioxide emissions in cattle using short-term breath measures. J Anim Sci. 2017;95(2):645-56. DOI: 10.2527/jas.2016.0700
[5] Arbre M, Rochette Y, Guyader J, Lascoux C, Gómez LM, Eugène M, et al. Repeatability of enteric methane determinations from cattle using either the SF6 tracer technique or the GreenFeed system. Anim Prod Sci. 2016;56(3):238-43. DOI: 10.1071/AN15512
[6] Manafiazar G, Zimmerman S, Basarab JA. Repeatability and variability of short-term spot measurement of methane and carbon dioxide emissions from beef cattle using GreenFeed emissions monitoring system. Can J Anim Sci. 2017;97(1):118-26. DOI: 10.1139/cjas-2015-0190